Fig. 4.
Download original image
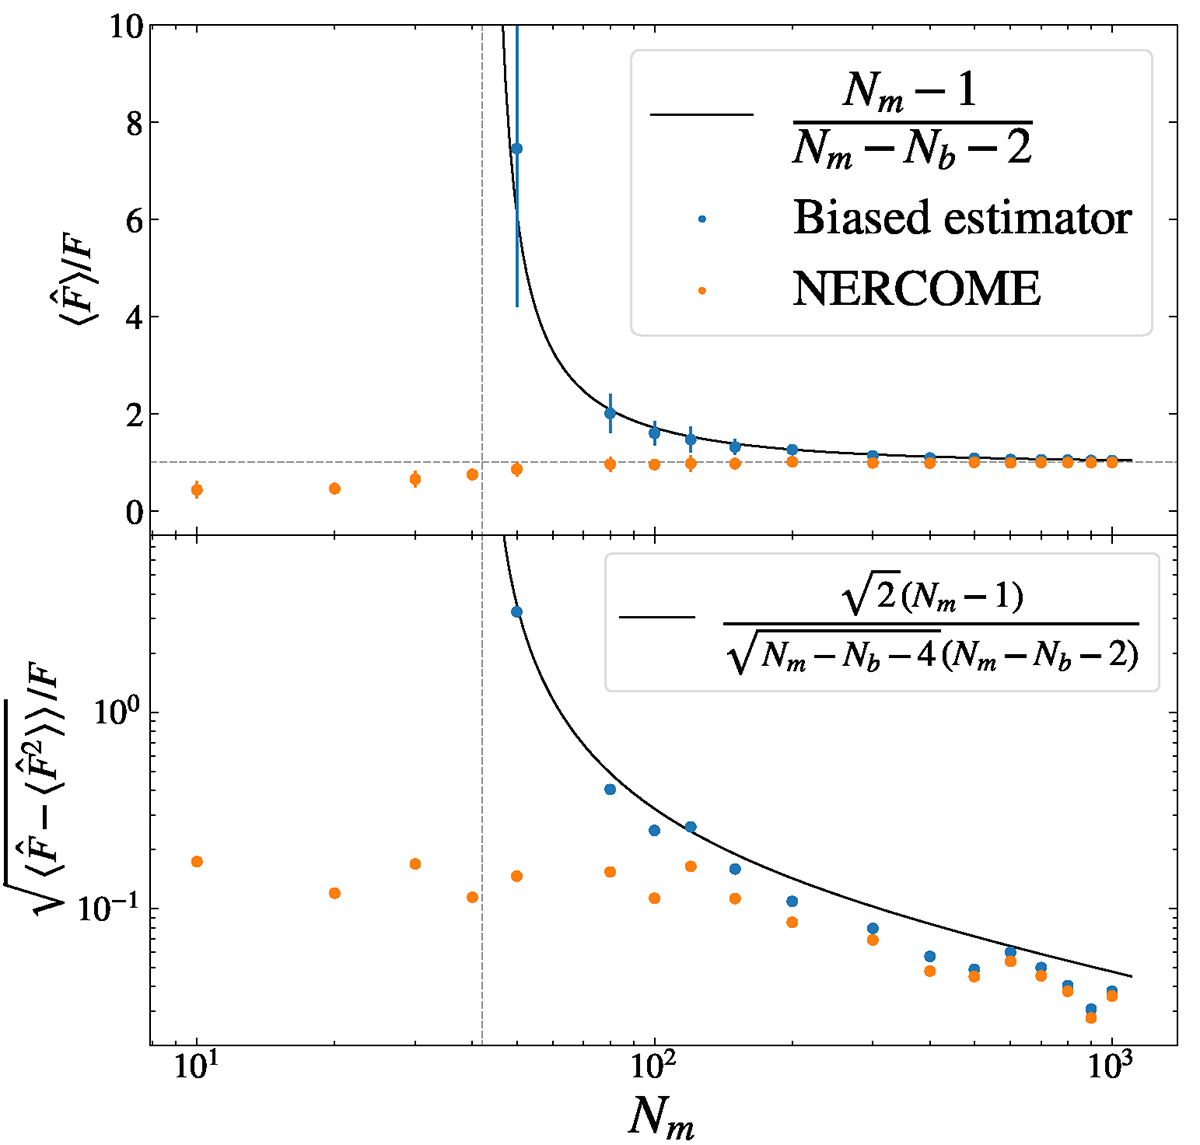
Bias (top) and dispersion (bottom) of the S/N defined in Eq. (15) when the precision matrix is estimated from Nm realisations and a data vector of size Nb = 40. The blue and orange filled circles respectively correspond to the biased (i.e. without the Hartlap correction) and NERCOME estimator. The black line represents the predictions from Eqs. (16) (top) and (17) (bottom). The vertical dashed grey line indicates the Hartlap limit Nm ≤ Nb + 2.
Current usage metrics show cumulative count of Article Views (full-text article views including HTML views, PDF and ePub downloads, according to the available data) and Abstracts Views on Vision4Press platform.
Data correspond to usage on the plateform after 2015. The current usage metrics is available 48-96 hours after online publication and is updated daily on week days.
Initial download of the metrics may take a while.