Fig. 2.
Download original image
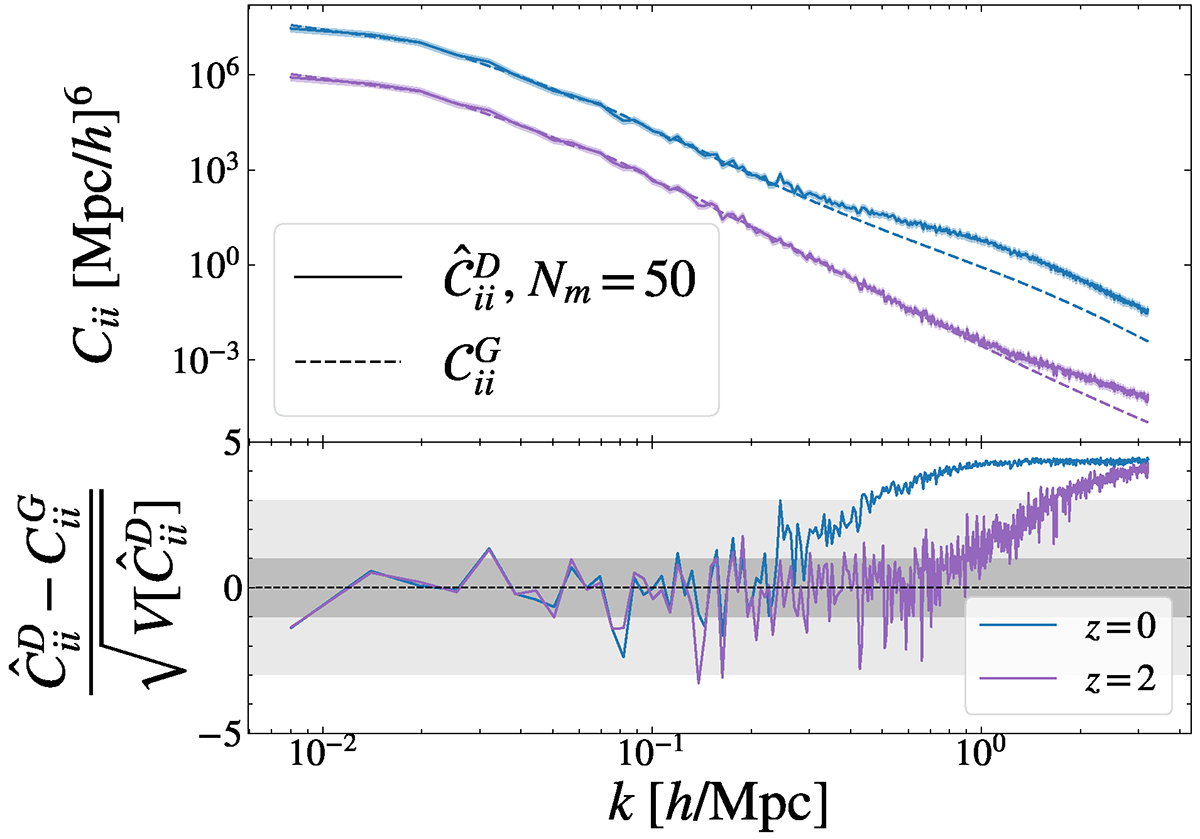
Variance of the DEMNUni-Cov power spectrum. Top: Diagonal of the power spectrum covariance matrix in the 16ν cosmology, at z = 0 (blue) and z = 2 (purple). Solid lines show the variance estimated from the 50 DEMNUni-Cov realisations and the dashed lines display the Gaussian predictions. Bottom: Residuals between the estimated variance and the corresponding Gaussian prediction normalised by the error on the estimated covariance, given by Eq. (3). The grey areas represent the 1-σ and 3-σ levels of the residual.
Current usage metrics show cumulative count of Article Views (full-text article views including HTML views, PDF and ePub downloads, according to the available data) and Abstracts Views on Vision4Press platform.
Data correspond to usage on the plateform after 2015. The current usage metrics is available 48-96 hours after online publication and is updated daily on week days.
Initial download of the metrics may take a while.