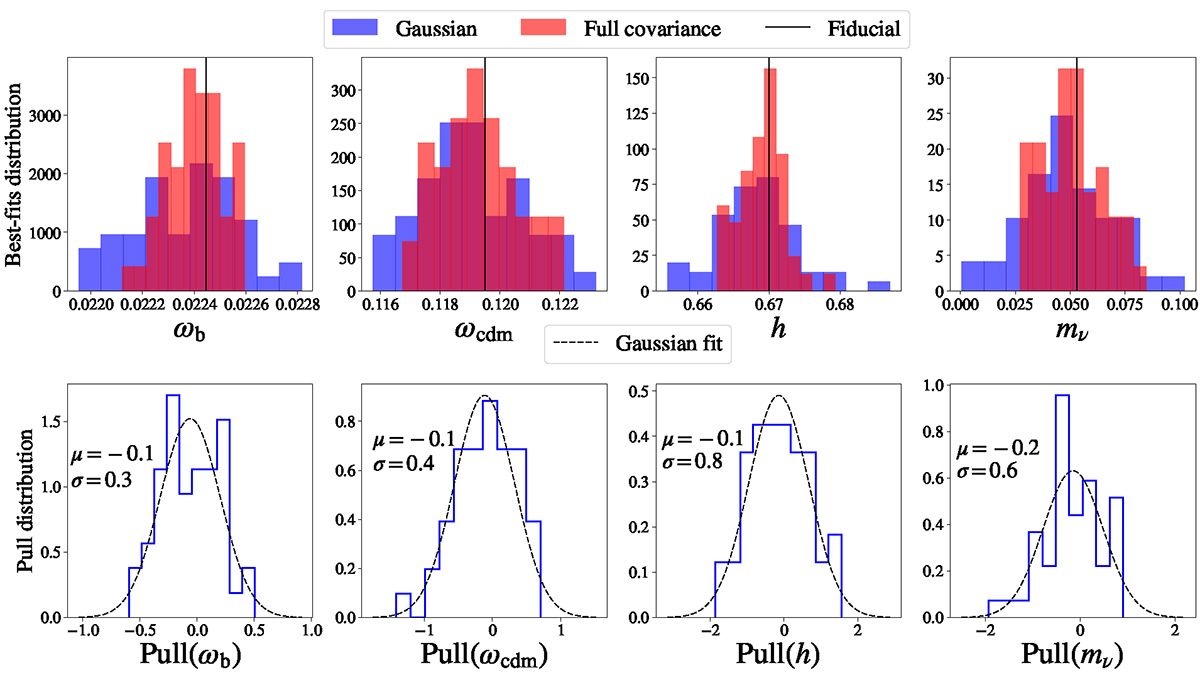
Fig. 18.
Download original image
Results from fitting 50 different realisations of the COVMOS_halofitP(k) at kmax = 0.25 h/Mpc. Top: Normalised distribution of best-fits in the case of the Gaussian (blue) and full covariance (red). Bottom: Normalised distribution of the pull as defined in Eq. (23). The black dashed line is a Gaussian fit to the histogram. The mean and standard deviation obtained from the fit for each parameter are written in each panel.
Current usage metrics show cumulative count of Article Views (full-text article views including HTML views, PDF and ePub downloads, according to the available data) and Abstracts Views on Vision4Press platform.
Data correspond to usage on the plateform after 2015. The current usage metrics is available 48-96 hours after online publication and is updated daily on week days.
Initial download of the metrics may take a while.