Fig. 1.
Download original image
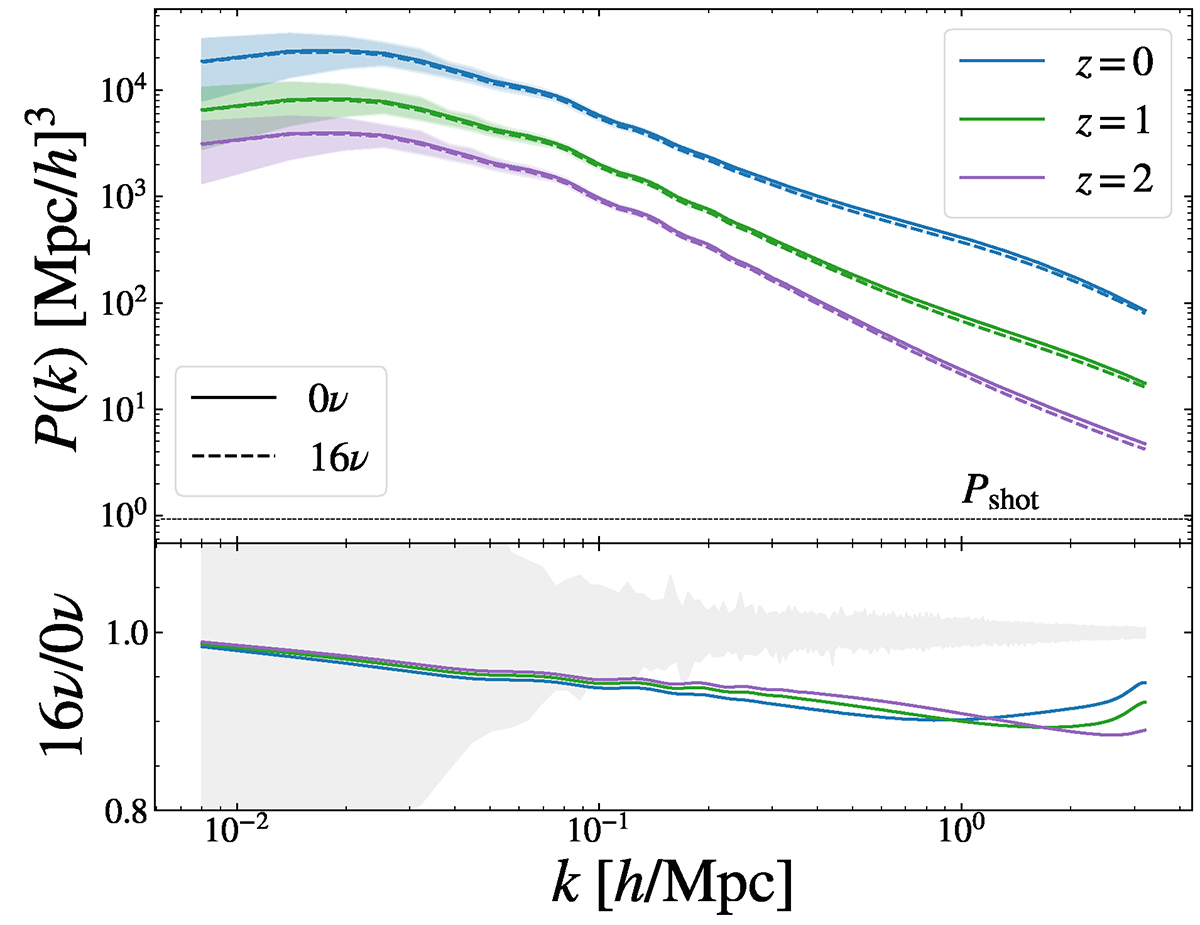
DEMNUni-Cov power spectrum. Top: The solid and dashed lines represents the mean DEMNUni-Cov power spectrum, for three snapshots and the two cosmologies 0ν and 16ν. The corresponding shaded regions show the dispersion over the 50 realisations. The black short dashed line is the shot-noise level for the 10243 CDM particles. Bottom: Ratio between the mean power spectrum of the massive neutrino cosmology and the mass-less one. The grey area represents the dispersion over the 50 realisations at z = 0.
Current usage metrics show cumulative count of Article Views (full-text article views including HTML views, PDF and ePub downloads, according to the available data) and Abstracts Views on Vision4Press platform.
Data correspond to usage on the plateform after 2015. The current usage metrics is available 48-96 hours after online publication and is updated daily on week days.
Initial download of the metrics may take a while.