Fig. 7
Download original image
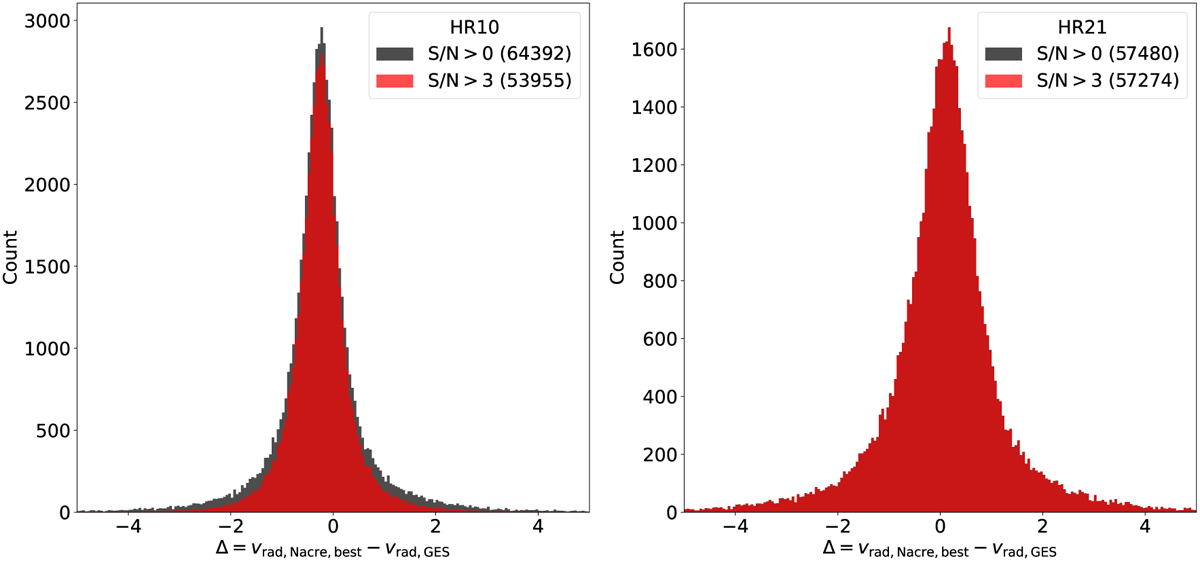
Distribution of ∆ = υrad,Nacre,best − υrad,GES for HR10 (left) and HR21 (right) observations where υrad,GES is the recommended Gaia-ESO RV. We show in black the case S/N ≥ 0 and in red, the case S/N ≥ 3. The mean, standard deviation and interquartile range of each distribution, expressed in km s−1, are: (−0.24, 1.47, 0.67) for HR10 with S/N > 0; (−0.25, 1.23, 0.56) for HR10 with S/N > 3; (0.07, 3.77, 1.05) for HR21 with S/N > 0; (0.07,3.77,1.03) for HR21 with S/N > 3. The number of objects in a given selection is indicated in the legend box. For HR21 (right), the two histograms are almost identical and the black one is not visible.
Current usage metrics show cumulative count of Article Views (full-text article views including HTML views, PDF and ePub downloads, according to the available data) and Abstracts Views on Vision4Press platform.
Data correspond to usage on the plateform after 2015. The current usage metrics is available 48-96 hours after online publication and is updated daily on week days.
Initial download of the metrics may take a while.