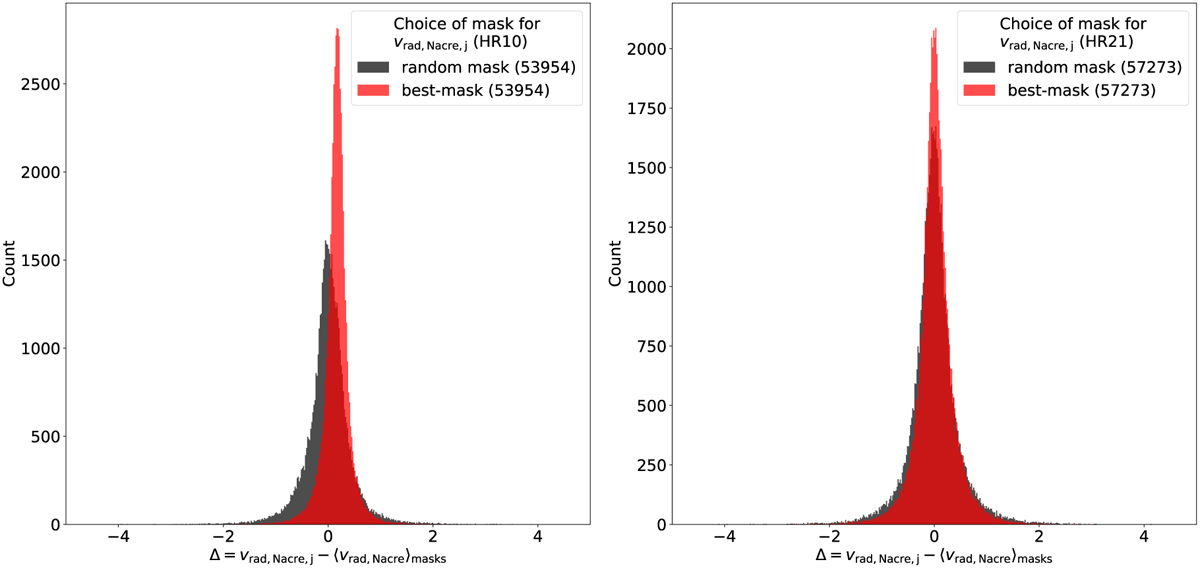
Fig. 6
Download original image
Distribution of ∆= υrad,Nacre,ref− 〈υrad,Nacre〉masks (binwidth = 0.02 km s−1) where υrad,Nacre,jis either the velocity υrad,Nacre,best returned by the bestmask NACRE CCF (see text; red) or a randomly chosen NACRE velocity υrad,Nacre,rand (black). Left: HR10 setup. Right: HR21. The mean, standard deviation and interquartile range of each distribution, expressed in km s−1, are: (0.17,0.59,0.22) for HR10 and ‘best mask’; (0.01,0.77,0.39) for HR10 and ‘random mask’; (0.02,0.38,0.33) for HR21 and best mask; (0., 0.50,0.41) for HR21 and random mask. The number of objects in a given selection is indicated in the legend box. The distributions are narrower for υrad,Nacre,best than for υrad,Nacre,rand.
Current usage metrics show cumulative count of Article Views (full-text article views including HTML views, PDF and ePub downloads, according to the available data) and Abstracts Views on Vision4Press platform.
Data correspond to usage on the plateform after 2015. The current usage metrics is available 48-96 hours after online publication and is updated daily on week days.
Initial download of the metrics may take a while.