Fig. 19
Download original image
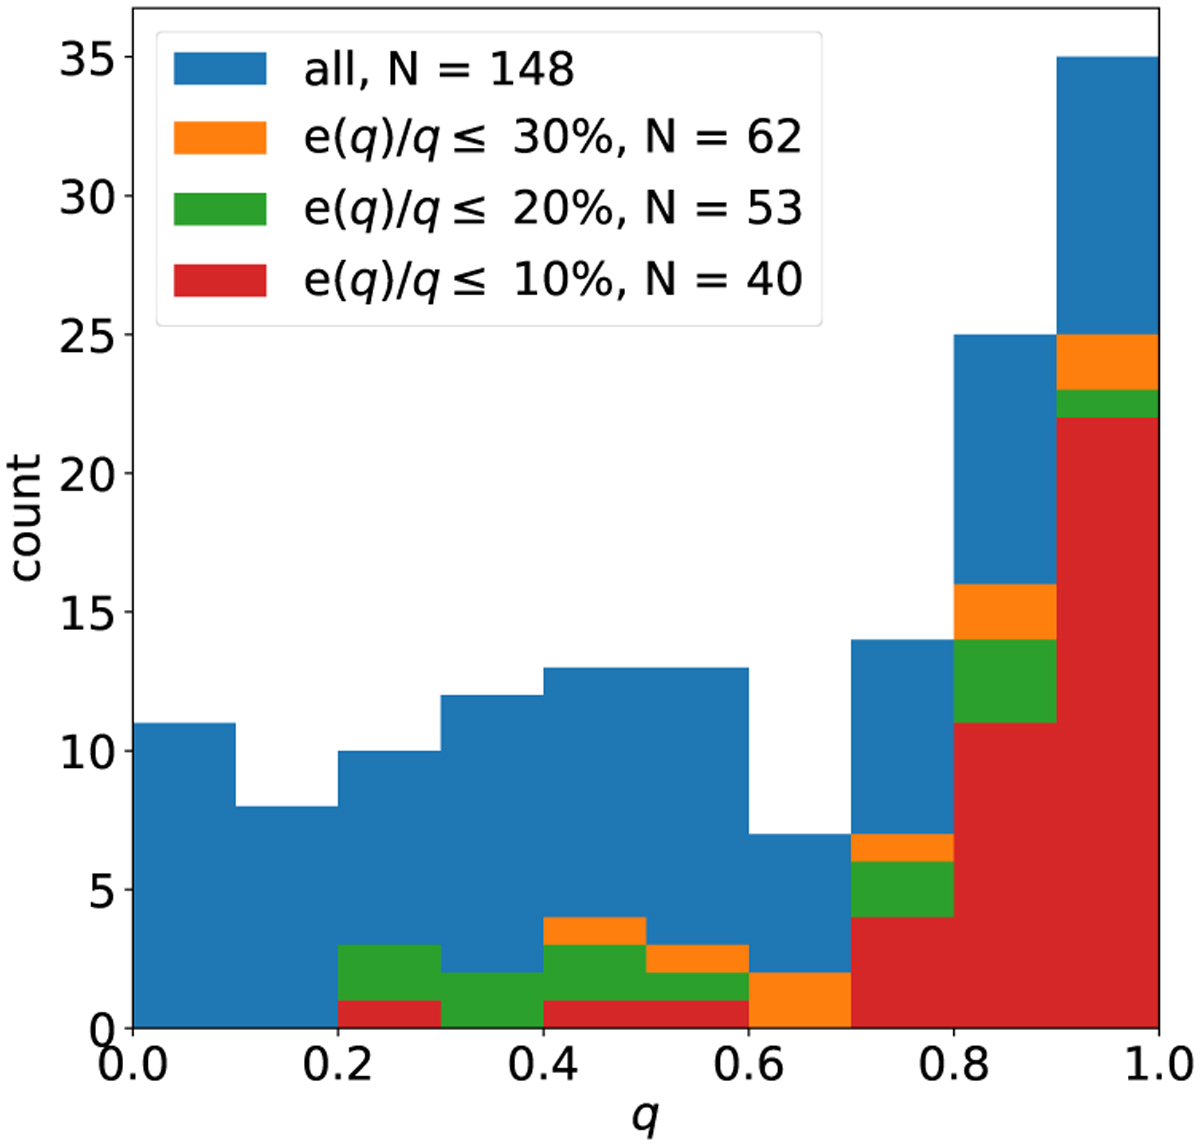
Mass ratio (q) distribution for the iDR5 SB2 sample. Blue: whole sample of 148 q estimates; orange: only systems with a relative uncertainty on q lower than 30 %; green: only systems with a relative uncertainty on q lower than 20 %; red: only systems with a relative uncertainty on q lower than 20 %. The number of systems for each cut is indicated in the legend box. The four histograms are superimposed; thus, for instance, the visible green part of the bars only shows the system with a relative uncertainty on q between 10 % and 20 %.
Current usage metrics show cumulative count of Article Views (full-text article views including HTML views, PDF and ePub downloads, according to the available data) and Abstracts Views on Vision4Press platform.
Data correspond to usage on the plateform after 2015. The current usage metrics is available 48-96 hours after online publication and is updated daily on week days.
Initial download of the metrics may take a while.