Open Access
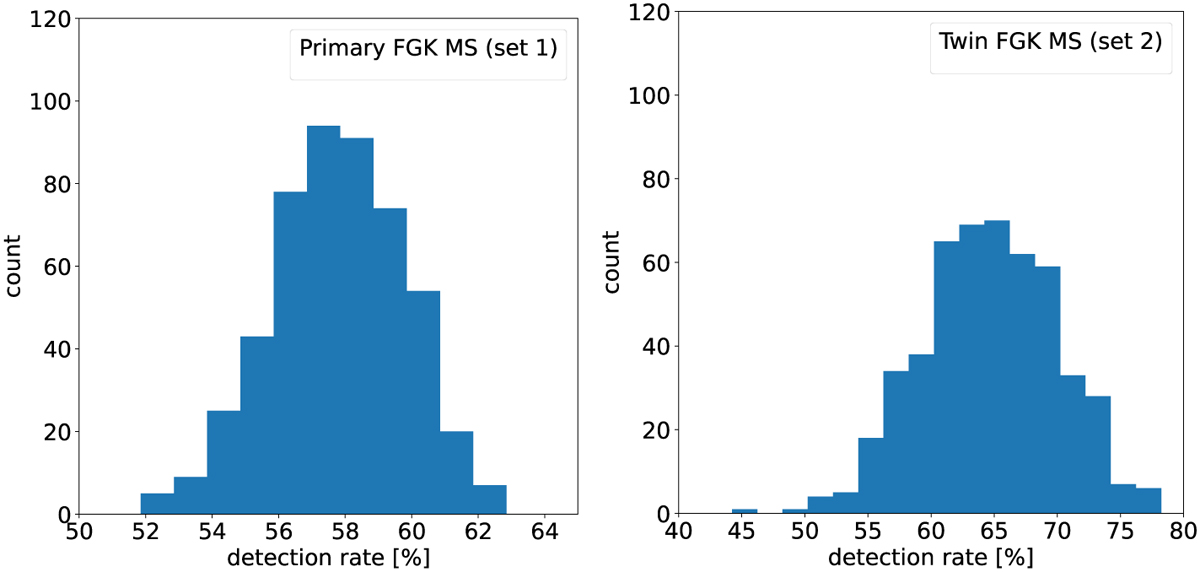
Fig. 18
Download original image
Distribution of the detection rates for set 1 (left; binwidth = 1%) and 2 (right; binwidth = 2%). The y-axis gives the count of simulations with a detection rate within the range defined by the bin coordinates. For instance, for the set 1, ≈94 out of 501 simulations have a detection rate between ≈57% and ≈58%.
Current usage metrics show cumulative count of Article Views (full-text article views including HTML views, PDF and ePub downloads, according to the available data) and Abstracts Views on Vision4Press platform.
Data correspond to usage on the plateform after 2015. The current usage metrics is available 48-96 hours after online publication and is updated daily on week days.
Initial download of the metrics may take a while.