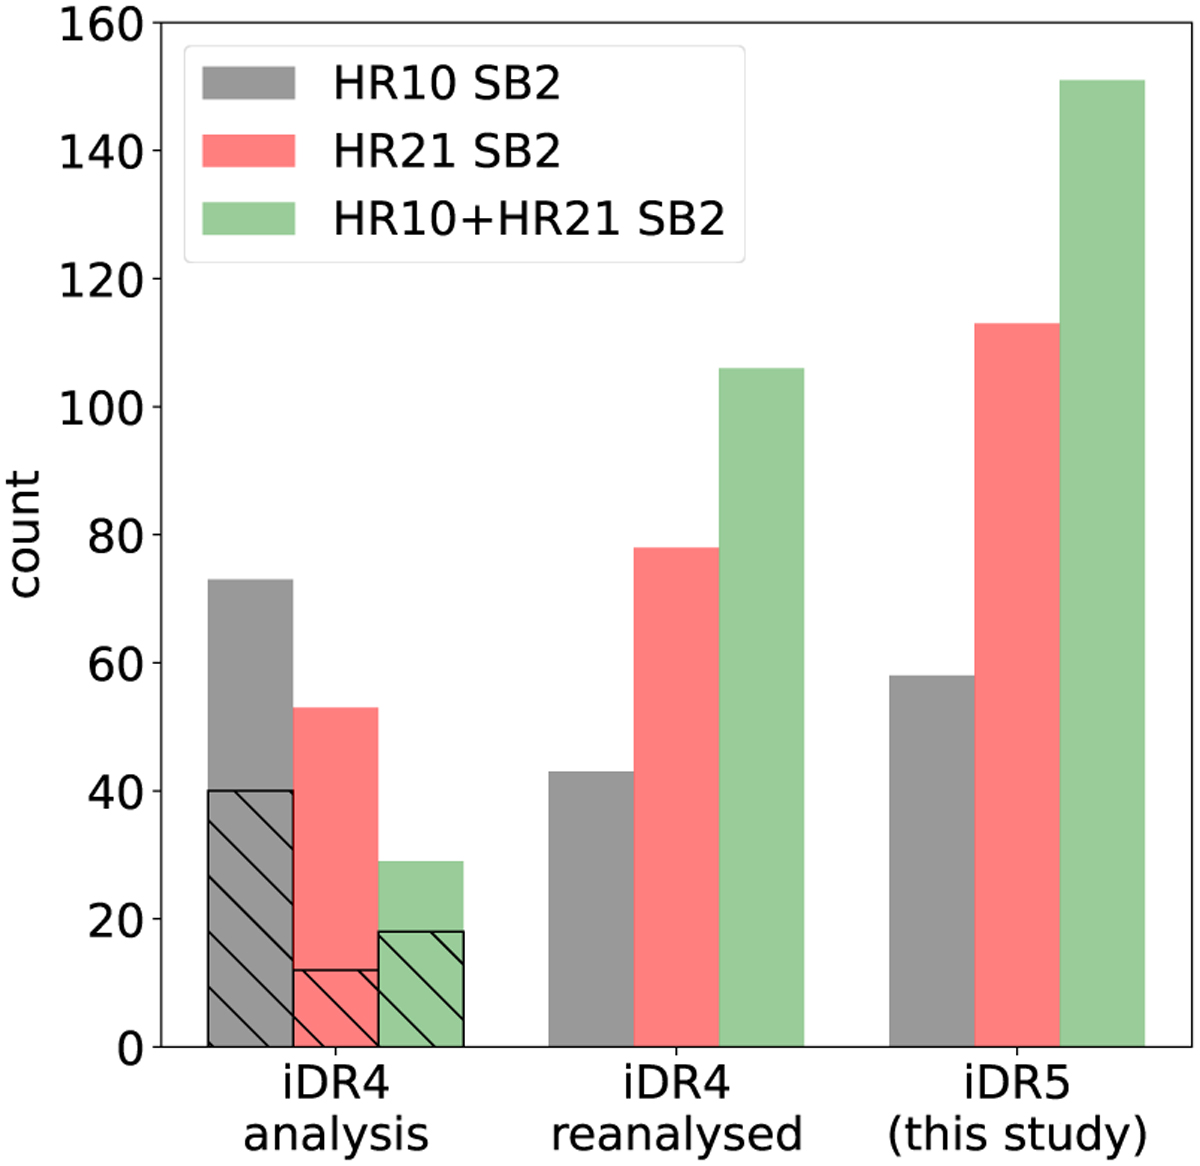
Fig. 17
Download original image
SB2 count depending on the setup(s) triggering the SB2 detection. Black: HR10 SB2, i.e. SB2 detected from HR10 observations only. Red: HR21 SB2, i.e. SB2 detected from HR21 observations. Green: HR10+21 SB2, i.e. SB2 detected from both HR10 and HR21 observations. Left: earliest iDR4 analysis by Merle et al. (2017). Middle: iDR4 re-analysis with NACRE masks. Right: iDR5 analysis (this study). In the left group, the hatched bars overplotted indicate the SB2 objects detected from HR10 only (resp., from H21 only; resp., from HR10 and HR21) in Merle et al. (2017) and that are now detected thanks to both setups in the iDR4 re-analysis. The difference of height between the hatched bar and that of the green bar is explained by about ten iDR4 SB2, formerly detected in both HR10 and HR21, and now detected only with one of the two setups (the best-mask CCF did not exist for S/N reasons in some cases).
Current usage metrics show cumulative count of Article Views (full-text article views including HTML views, PDF and ePub downloads, according to the available data) and Abstracts Views on Vision4Press platform.
Data correspond to usage on the plateform after 2015. The current usage metrics is available 48-96 hours after online publication and is updated daily on week days.
Initial download of the metrics may take a while.