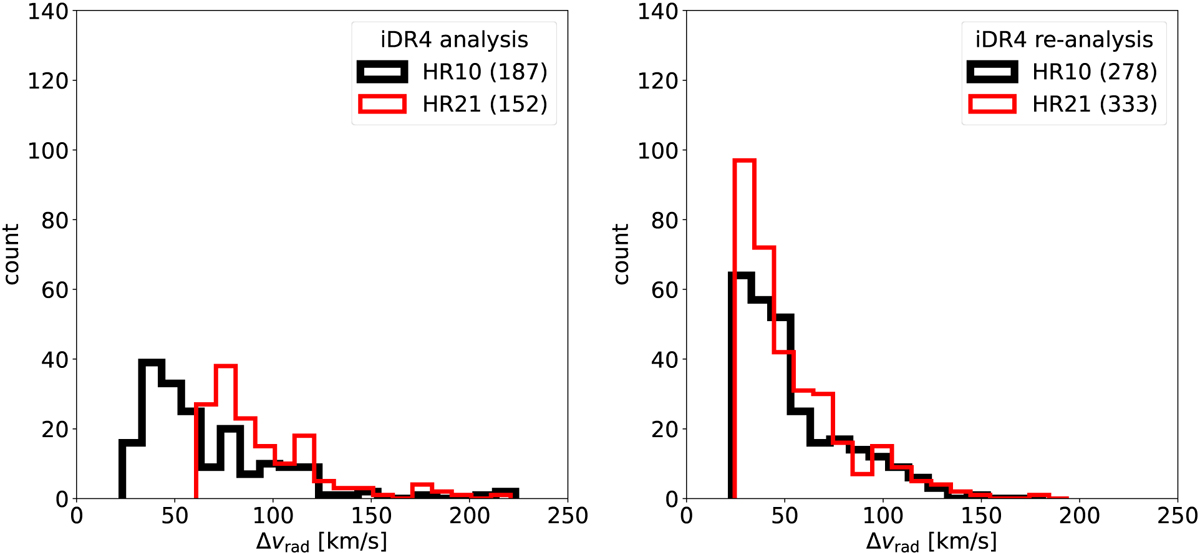
Fig. 16
Download original image
∆υrad distributions for HR10 (thick black line) and HR21 (thin red line) observations triggering an SB2 detection. Left: earliest iDR4 analysis described in Merle et al. (2017); right: iDR4 re-analysis (this study). We are interested in the individual exposures, therefore an SB2 with more than one epoch will be counted more than once and may appear in different bins depending on the change of its components velocities from one epoch to another.
Current usage metrics show cumulative count of Article Views (full-text article views including HTML views, PDF and ePub downloads, according to the available data) and Abstracts Views on Vision4Press platform.
Data correspond to usage on the plateform after 2015. The current usage metrics is available 48-96 hours after online publication and is updated daily on week days.
Initial download of the metrics may take a while.