Fig. 14
Download original image
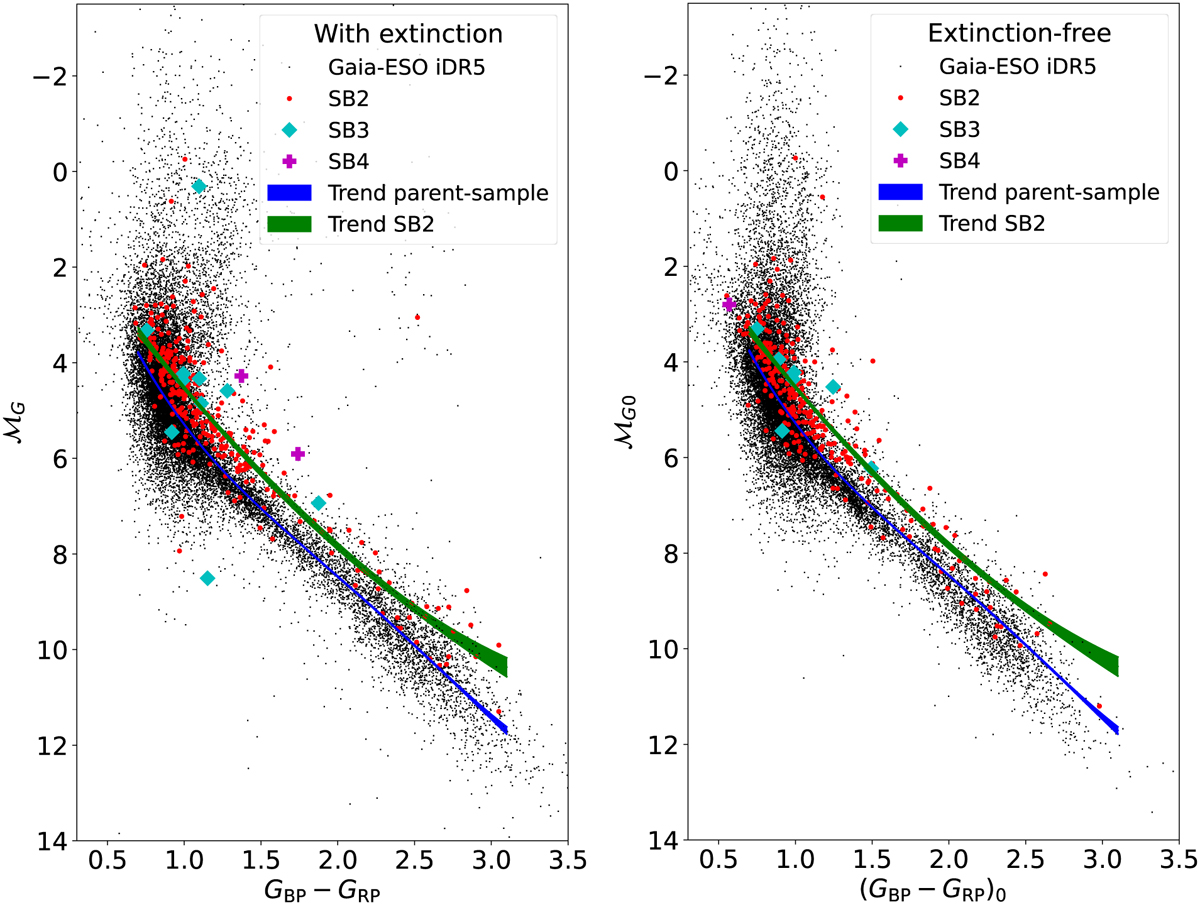
Colour-magnitude diagram of the Gaia-ESO parent sample (black dot). Spectroscopic binaries are overplotted: SB2 (red disc), SB3 (cyan diamond), and SB4 (magenta plus). ℳG is the absolute magnitude in the G band. The blue and green thick lines are respectively a quartic and quadratic fit of the rebinned parent-sample main-sequence and of the rebinned SB2 sequence. The width of the lines materialises the 1 – σ uncertainty on the locus of these two trends only due to the uncertainties on the parallaxes and photometry; the thickness of these lines is therefore not related to the vertical scatter of the datapoints. Left: photometric quantities are not corrected for the extinction. Right: photometric quantities are corrected for the extinction by using AG and E(GBP − GRP) from Gaia DR3.
Current usage metrics show cumulative count of Article Views (full-text article views including HTML views, PDF and ePub downloads, according to the available data) and Abstracts Views on Vision4Press platform.
Data correspond to usage on the plateform after 2015. The current usage metrics is available 48-96 hours after online publication and is updated daily on week days.
Initial download of the metrics may take a while.