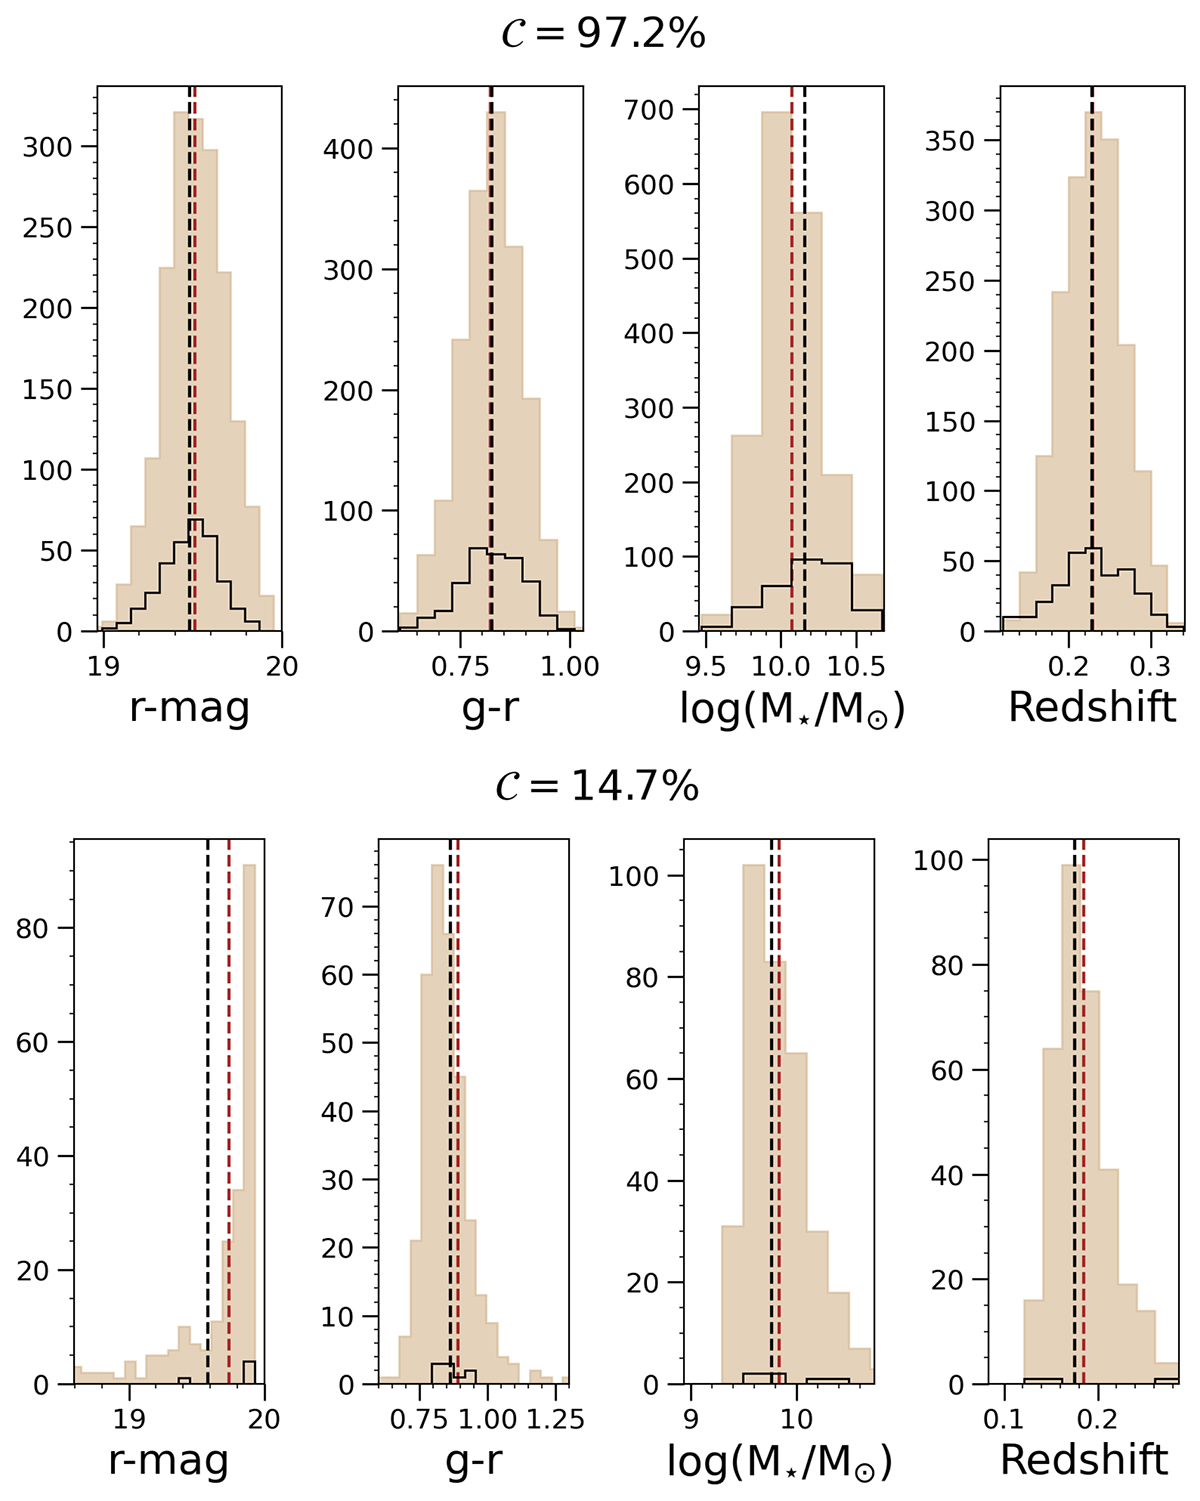
Fig. 5.
Download original image
Distributions of selected galaxy properties for two example SOM cells, one where GAMA completeness is very high (cell [18, 29], upper panels) and one where it is low (cell [15, 22], lower panels). From left to right, we show the observed r-band magnitude, g − r color, stellar mass, and ANNz2 photometric redshift. Photometric KiDS-Bright data is plotted as filled brown bars, while spectroscopic GAMA is given by black lines. Vertical dashed lines indicate means: for KiDS-Bright in red and for GAMA in black.
Current usage metrics show cumulative count of Article Views (full-text article views including HTML views, PDF and ePub downloads, according to the available data) and Abstracts Views on Vision4Press platform.
Data correspond to usage on the plateform after 2015. The current usage metrics is available 48-96 hours after online publication and is updated daily on week days.
Initial download of the metrics may take a while.