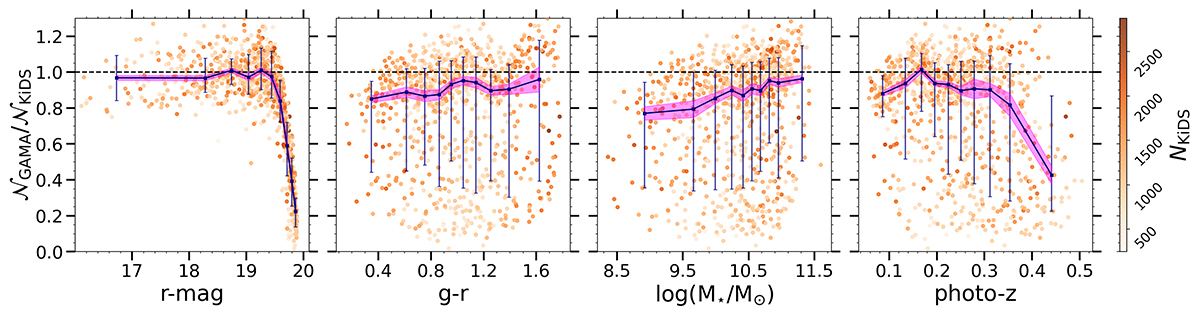
Fig. 4.
Download original image
Dependence of the GAMA completeness (w.r.t. KiDS) on selected properties of the KiDS-Bright sample, based on SOM projections. The completeness is expressed as the per-cell ratio of GAMA and KiDS-Bright surface density. The panels show from left to right: r-band AUTO magnitude, g − r color, logarithm of stellar mass, and ANNz2 photometric redshifts. Each orange dot represents one SOM cell, while the blue points are median values with central 68-percentile error bars. Binning is done by preserving the same number of averaged cells per bin. The pink-shaded regions show the bootstrap error from 10 000 bootstrap samples, as an approximation to the uncertainty on the median.
Current usage metrics show cumulative count of Article Views (full-text article views including HTML views, PDF and ePub downloads, according to the available data) and Abstracts Views on Vision4Press platform.
Data correspond to usage on the plateform after 2015. The current usage metrics is available 48-96 hours after online publication and is updated daily on week days.
Initial download of the metrics may take a while.