Fig. A.6.
Download original image
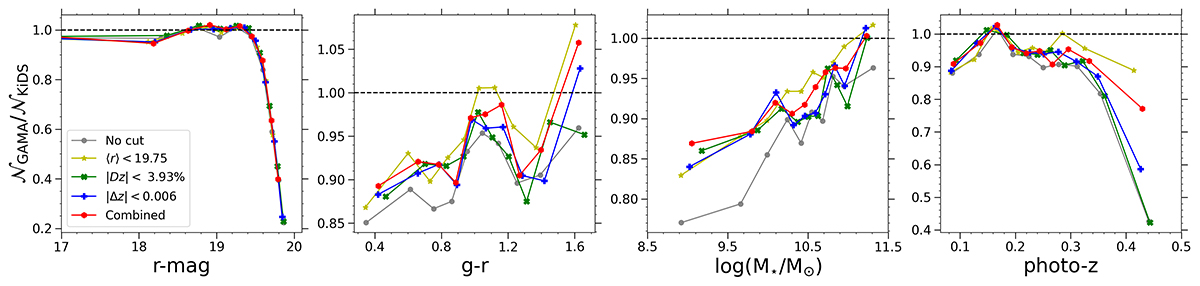
Dependence of the GAMA completeness on selected properties of the KiDS-Bright sample, based on SOM projections. The completeness is expressed as the per-cell ratio of GAMA and KiDS-Bright surface density. The gray data points are the same as in Fig. 4, illustrating binned medians for the full KiDS-Bright. The other colors show the completeness after applying cuts on the photometric sample, each employing SOM cell averages, namely: (i) based on ⟨r⟩< 19.75 (yellow), (ii) based on relative difference |Dz|< 3.93% (green), (iii) based on |Δz|< 0.006 (blue), and finally (iv) a combined cut ⟨r⟩< 19.84, |Dz|< 6.48%, |Δz|< 0.01 (red) removing ∼20% KiDS-Bright galaxy sample for each case.
Current usage metrics show cumulative count of Article Views (full-text article views including HTML views, PDF and ePub downloads, according to the available data) and Abstracts Views on Vision4Press platform.
Data correspond to usage on the plateform after 2015. The current usage metrics is available 48-96 hours after online publication and is updated daily on week days.
Initial download of the metrics may take a while.