Fig. A.4.
Download original image
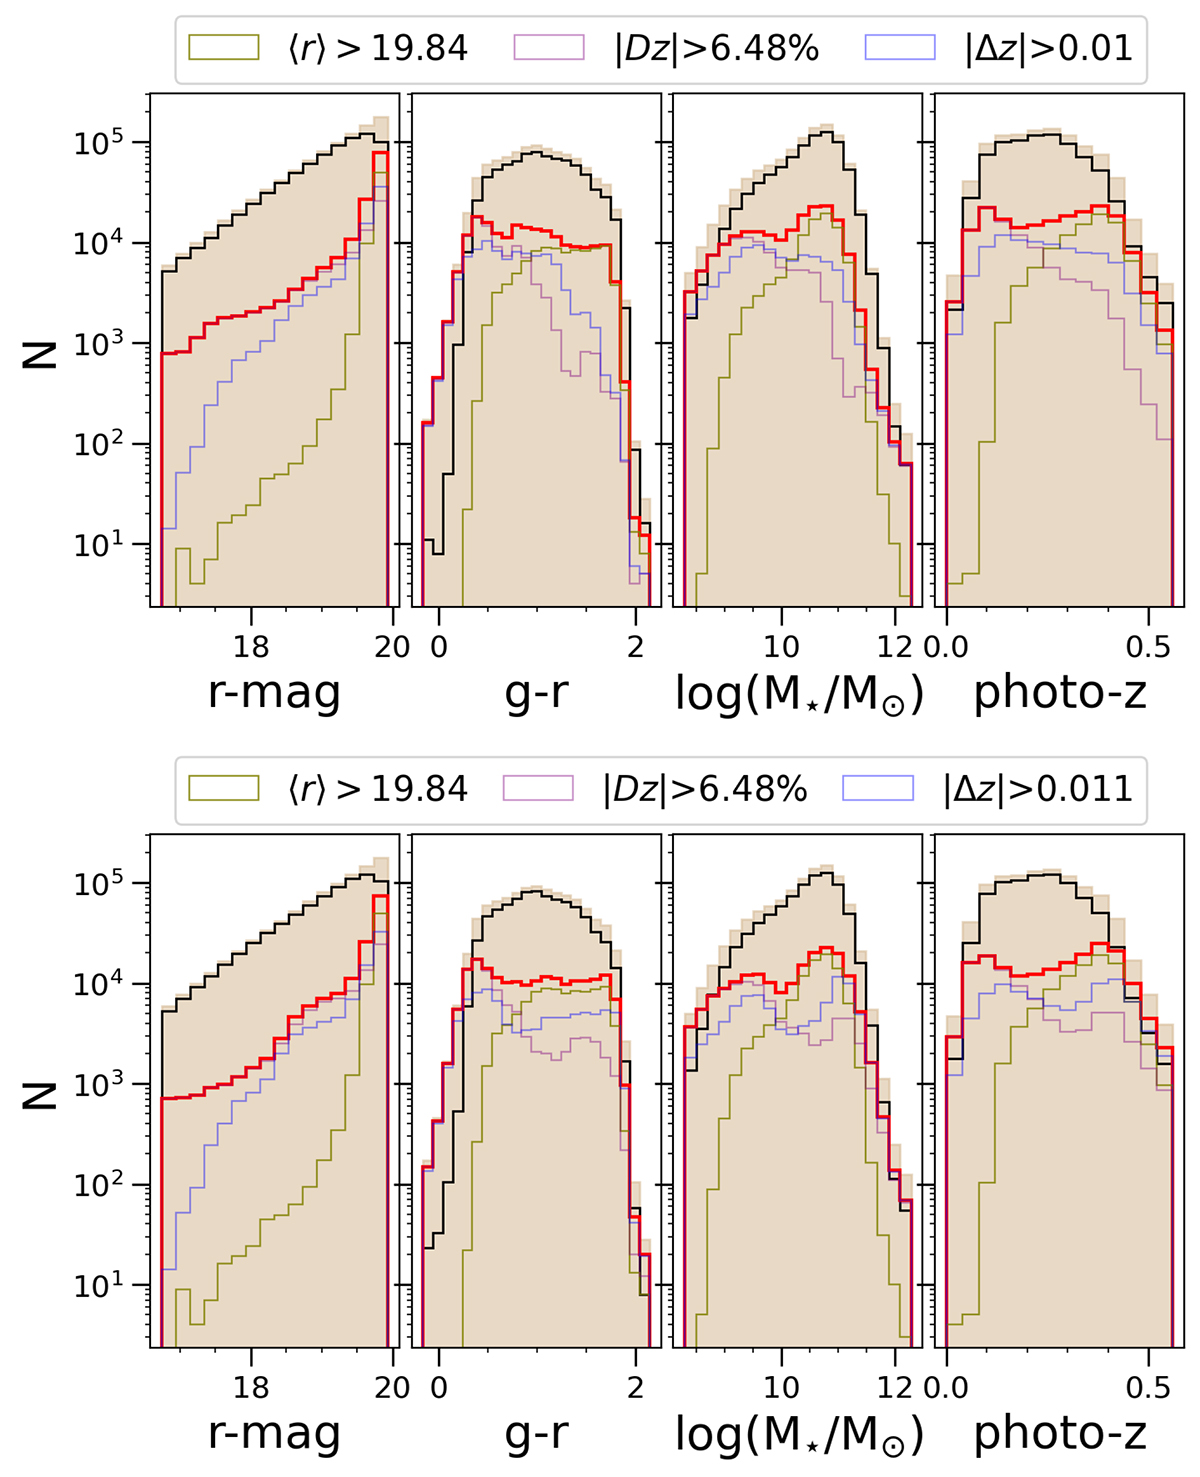
Same as Fig. 11 but instead of 10% removal of galaxies, removing ∼19% galaxies. Upper panels: The tan histograms show the distribution of KiDS galaxies versus r-magnitude, g-r color, stellar mass, and photometric redshifts. The red histogram shows the galaxies from the cells with either ⟨r⟩> 19.84 (green), |Dz|> 6.48% (purple), and based on |Δz|> 0.01 (blue), removing ∼19% galaxies. The 80% of the clean samples are shown in black. Bottom panels: Same as the upper panel, but the spectroscopic redshift is the mean from the Espec sample instead of GAMA in each SOM cell with |Dz|> 6.48% (purple), and based on |Δz|> 0.011, removing ∼19% galaxies.
Current usage metrics show cumulative count of Article Views (full-text article views including HTML views, PDF and ePub downloads, according to the available data) and Abstracts Views on Vision4Press platform.
Data correspond to usage on the plateform after 2015. The current usage metrics is available 48-96 hours after online publication and is updated daily on week days.
Initial download of the metrics may take a while.