| Issue |
A&A
Volume 692, December 2024
|
|
|---|---|---|
| Article Number | A30 | |
| Number of page(s) | 7 | |
| Section | Celestial mechanics and astrometry | |
| DOI | https://doi.org/10.1051/0004-6361/202452281 | |
| Published online | 29 November 2024 | |
Reassessing the proper motions of M31/M33 with Gaia DR3
Unravelling systematic uncertainties
1
Université de Strasbourg, CNRS, Observatoire astronomique de Strasbourg,
UMR 7550,
67000
Strasbourg,
France
2
Kapteyn Astronomical Institute, University of Groningen,
Landleven 12,
9747 AD
Groningen,
The Netherlands
3
Max-Planck-Institut für Astronomie,
Königstuhl 17,
69117
Heidelberg,
Germany
★ Corresponding author; samuel.rusterucci@astro.unistra.fr
Received:
17
September
2024
Accepted:
21
October
2024
We provide an updated inference of the proper motion of M31 using the Gaia DR3 proper motions of bright stars from the disc of M31. By refining the motion of the quasar reference frame, and statistically accounting for the variations in the inferred proper motions obtained across different regions of M31, we demonstrate that these inconsistencies most likely arise from systematic uncertainties. Our updated favoured values for the proper motion of M31 are 46.9 ± 11.7(stat) ± 50.6(sys) µas yr−1 in the right ascension direction and −29.1 ± 9.4(stat) ± 35.6(sys) µas yr−1 in the declination direction, the systematics being determined at a 90% confidence level (the values for M33 are given in the paper). This clearly highlights that the systematics are the dominant source of uncertainty, their magnitudes being comparable to the proper motion of M31 itself. The analysis conducted using Gaia DR2 instead of DR3 revealed that a net reduction in these systematic uncertainties occurred between the two data releases. If similar progress is made with the upcoming DR4, the future Gaia-based estimates could match the uncertainty level of HST, and could be used to refine the dynamics and history of M31 and M33.
Key words: galaxies: kinematics and dynamics / Local Group / proper motion
© The Authors 2024
 Open Access article, published by EDP Sciences, under the terms of the Creative Commons Attribution License (https://creativecommons.org/licenses/by/4.0), which permits unrestricted use, distribution, and reproduction in any medium, provided the original work is properly cited.
This article is published in open access under the Subscribe to Open model. Subscribe to A&A to support open access publication.
1 Introduction
The proper motion of the Andromeda galaxy (M31) is an essential piece of information to constrain the past, present, and future of the Local Group. While it is often assumed that most of the motion of M31 is carried by its radial velocity component (e.g. the timing argument; Kahn & Woltjer 1959; Li & White 2008; Peñarrubia et al. 2016), useful measurements of its proper motion were only made possible over the last two decades from the use of indirect methods or significant advances in astrometric measurements.
Indirect measurements of the proper motion of M311 are primarily constrained by the radial velocities of its satellites, and were measured to be ( ) = (21.5 ± 11.1, −10.4 ± 9.3) µ as yr−1 (van der Marel & Guhathakurta 2008) and (9.1 ± 19.0, 5.6 ± 16.3) µ as yr−1 (Salomon et al. 2016). These results, which are compatible with each other, when translated into the galactocentric frame of reference, display a substantial tangential motion that is not negligible compared to its radial counterpart. Nonetheless, these estimates rely on the assumption that, dynamically, M31 satellites are pressure-supported and virialised, which may well not be the case given the observed presence of a plane of co-rotating satellites that includes about half of the known dwarf galaxies of M31 (Ibata et al. 2013).
The direct measurements make use of the individual proper motions of stars within the disc of M31. Sohn et al. (2012) and van der Marel et al. (2012b) were the first to make such an attempt with highly accurate Hubble Space Telescope (HST) data from three deep fields (3.37′ × 3.37′), observed at two different epochs. Accounting for the internal kinematics of M31, they derived a weighted average of ( ) = (44.1 ± 12.7, −31.8 ± 12.2) µas yr−1 for the three fields, only marginally changing the results they obtained without considering the intrinsic motions of the stars within M31. This result is in much better agreement with a nearly radial orbit, but less so with the results from the indirect methods. They also derived a value by combining their direct measurement with indirect measurements to further constrain the motion of M31. Finally, the studies of van der Marel et al. (2019) and Salomon et al. (2021, hereafter S21), which respectively used the data from Gaia DR2 and EDR3, concluded that the proper motion of M31 is nearly radial for the latter study, but less so for the former. However, there are incompatibilities between the two samples analysed by S21. Their blue giant sample, which they consider to be more reliable due to its larger size and lower contamination, gives a nearly radial motion. In contrast, the red giant sample does not support this conclusion, even though it is inconceivable that two populations belonging to the disc of M31 move in different directions. Unfortunately, only hints could be offered in an attempt to explain these discrepancies, prompting us to revisit the study by S21, this time using data from Gaia DR3, with a particular focus on refining the reference frame around M31.
Our motivation stems from the possibility of some systematic uncertainties on the Gaia celestial reference frame (CRF) that are unaccounted for at small scales. As is shown in Figure 13 from Lindegren et al. (2021b) and pointed out quantitatively in their Table 7, the CRF presents local uncertainties of the order of ±17.2 µas yr−1 for angular scales larger than 0.5°. At the distance of M31, this corresponds to ±63.9 km s−1 (assuming dM31 = 785 ± 25 kpc, McConnachie et al. 2005), which is on the order of magnitude of the previously measured tangential velocities. Here, we aim to refine the CRF by complementing the catalogue of quasars used to produce the Gaia CRF, making use of the recently published extragalactic Gaia catalogue (Gaia Collaboration 2023a). Given the very small values of the proper motion of M31, we also aim to carefully assess the level of systematic uncertainties present in the Gaia data.
The structure of this paper is as follows. In Section 2, we describe our data and the statistical method used to infer the proper motion of M31. In Section 3, we derive an updated proper motion and estimate its systematic uncertainty. Finally, we discuss our results and conclude in Section 4.
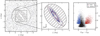 |
Fig. 1 Spatial and CMD locations of stars and quasars around M31. Left-hand panel: quasars from the Gaia CRF3 (in grey) and added by the latest Gaia catalogue of extra-galactic objects (in black) centred on M31. Middle panel: final blue and red samples of M31 stars superimposed on the central ellipse representing the geometrical cut made on M31. Each quadrant depicted by dashed lines contains the same number of blue stars and the hatched region is used to estimate the properties of the contamination. Right-hand panel: CMD of all the objects from the previous panels. |
2 Methods
2.1 Data selection
For the full analysis, we use the Gaia information provided in Gaia Collaboration (2023b).
Star samples: To isolate M31 disc stars in the Gaia catalogue, we have used the various spatial, colour-magnitude, proper motion2, and Gaia quality cuts (they are the same as in S21). The purpose of these cuts is to remove the contamination from foreground Milky Way (MW) stars and also stars with poor astrometric solutions. This leads to two separate samples of blue (young giant candidates; Bpm sample) and red (older supergiant candidates; Rpm sample) stars containing 1867 and 1543 objects, respectively. These stars are displayed on the sky and in the colour-magnitude diagram (CMD) in Figure 1. Using the region surrounding the disc of M31 (hashed region in Figure 1), we estimate that the two samples suffer from only low levels of contamination, in agreement with the previous study (1.1% and 1.8%, respectively). The spatial distributions of the samples exhibit expected properties: stars from the blue sample are predominantly located in the ring of active star formation of the disc of M31 (Lewis et al. 2015), while the red stars are more sparsely distributed, but remain mainly confined to the region of the disc.
Quasar sample: Quasars used by the Gaia consortium to produce the CRF of the DR3 were selected from a large set of photometric and spectroscopic catalogues. These, however, may become heavily contaminated around nearby extended objects such as M31. In this case, only highly reliable quasars, confirmed through other means (e.g. VLBI observations), were kept to constrain the reference frame (Gaia Collaboration 2022). This leads to a drop in the density of quasars in the central ~3° region around M31 (grey dots in the left-hand panel of Figure 1), which we can expect to locally lower the quality of the reference frame. To improve the latter, we complemented the set of quasars used to build the CRF with additional objects selected from the latest Gaia catalogue of extragalactic objects (Gaia Collaboration 2023a). In particular, we selected sources that are highly likely to be quasars3, shown as black dots in Figure 1. These newly added sources increased the central density from 19 deg−2 to 34 deg−2, compared to an average of 42 deg−2 over the whole sky4. Our final sample consists of 26,741 quasar candidates.
2.2 Proper motion inference
We aim to infer the global proper motion of stars in the Gaia sample with a refined CRF. To do so, we assume that, for a given sample of objects (stars or quasars) of size n, we have a set of data points, 𝓓 = {dk}1≤k≤n, with a datum, dk, defined by the Gaia position (αk,δk) and proper motion (µα,k,µδ,k), along with their associated uncertainties5 (δµα,k, δµδ,k) and correlation coefficient (ρk). That is: dk = {αk,δk,µα,k,µδ,k,δµα,k,δµδ,k,ρk}. The likelihood of all n sources following a certain model specified by a set of parameters, 𝒫, is
 (1)
(1)
where Ptot(𝓓|𝒫) is the sum of two probabilistic models, Ppop and Pcont , which represent the main population of M31 stars and contaminants, respectively.
 (2)
(2)
where the parameter fc represents the fraction of contaminants.
We chose to model Ppop as a two-dimensional Gaussian in the (µα , µδ) space, centred on the mean motion given by parameters  . The width of the Gaussian in the model is assumed to be entirely driven by the proper motion uncertainties and we have foregone parameters that would represent the intrinsic dispersion of sources6. Therefore, we have
![$\eqalign{ & {P_{{\rm{pop}}}}\left( {{{\bf{d}}_k}\mid {P^{{\rm{pop}}}}} \right) = {1 \over {2\pi \delta {\mu _{\alpha ,k}}\delta {\mu _{\delta ,k}}\sqrt {\left( {1 - \rho _k^2} \right)} }} \cr & \times \exp \left[ { - {1 \over {2\left( {1 - \rho _k^2} \right)}}\left( {{{\Delta \mu _{\alpha ,k}^2} \over {\delta \mu _{\alpha ,k}^2}} + {{\Delta \mu _{\delta ,k}^2} \over {\delta \mu _{\delta ,k}^2}} - {{2{\rho _k}\Delta {\mu _{\alpha ,k}}\Delta {\mu _{\delta ,k}}} \over {\delta {\mu _{\alpha ,k}}\delta {\mu _{\delta ,k}}}}} \right)} \right], \cr}](/articles/aa/full_html/2024/12/aa52281-24/aa52281-24-eq6.png) (3)
(3)
with  being the offsets between a source’s proper motion and the modelled motion of the considered population at this location. In the specific case of the stars of M31, a term accounting for the intrinsic motion of a star at position k was subtracted from Δµα/δ,k. The value of this term was determined from the motion predicted by the disc model developed by Chemin et al. (2009) for a star located at (αk, δk). In the case of the quasars, no additional term is needed as, on average, they are not expected to move.
We also chose Pcont to be modelled by a two-dimensional Gaussian. However, this time, the intrinsic dispersion of the contaminating stars cannot be assumed to be negligible anymore. The parameters are therefore the means and dispersions in the two-dimensional proper motion space; that is,  . Therefore,
![$\eqalign{ & {P_{{\rm{cont }}}}\left( {{{\bf{d}}_k}\mid {P^{{\rm{cont }}}}} \right) = {1 \over {2\pi \sqrt {{{\left( {\sigma _\alpha ^{{\rm{cont }}}} \right)}^2} + \delta \mu _{\alpha ,k}^2} \sqrt {{{\left( {\sigma _\delta ^{{\rm{cont }}}} \right)}^2} + \delta \mu _{\delta ,k}^2} }} \cr & \times \exp \left[ { - {1 \over 2}\left( {{{{{\left( {{\mu _{\alpha ,k}} - \mu _\alpha ^{{\rm{cont }}}} \right)}^2}} \over {\left[ {{{\left( {\sigma _\alpha ^{{\rm{cont }}}} \right)}^2} + \delta \mu _{\alpha ,k}^2} \right]}} + {{{{\left( {{\mu _{\delta ,k}} - \mu _\delta ^{{\rm{cont }}}} \right)}^2}} \over {\left[ {{{\left( {\sigma _\delta ^{{\rm{cont }}}} \right)}^2} + \delta \mu _{\delta ,k}^2} \right]}}} \right)} \right]. \cr}](/articles/aa/full_html/2024/12/aa52281-24/aa52281-24-eq9.png) (4)
(4)
Following Bayes’ theorem, the posterior probability distribution function (PDF), Ptot(𝒫|𝓓), is related to the likelihood, Ptot(𝓓|𝒫), through priors, P(𝒫), such that
 (5)
(5)
We assume uniform priors for all free parameters except for  , for which a flat truncated prior is preferred. We chose 0 ≤ fc ≤ 0.1 as we estimated that the contamination for both samples of stars does not exceed 2%. We chose
  mas yr−1, as we estimated it to be ∼1.5 mas yr−1. We sampled the posterior PDFs using a Markov chain Monte Carlo (MCMC) method with our own implementation of the Metropolis-Hastings algorithm (Metropolis et al. 1953; Hastings 1970).
3 Results
3.1 Correcting for the motion of the reference
The Gaia data is of exceptional accuracy; however, at the distance of M31, motions of the order of a few tenths of a µas yr−1 cannot be neglected. The motion of the Gaia reference quasars is expected to be consistent with 0 µas yr−1 . Nonetheless, there are reasons to expect that small systematics of the order of 10 µas yr−1 remain on small spatial scales (see Lindegren et al. 2021b, Table 7). Here, we aim to quantify the level of these systematics so that they can be folded into the analysis of the movement of M31 stars.
We first created a spatial grid with bins of size 72″×72″, entirely covering M31 and parts of its outskirts. Using the method introduced in Section 2.2, we inferred, for each bin, the mean motion of all quasars within a radius of 2.5◦ from the centre of the bin. This choice of radius serves two purposes: it makes sure that our approach remains as local as possible, while also ensuring that each sample contains a minimum of 600 quasars. This number yielded reasonable uncertainties of ∼10 µas yr−1 on each inference. The resulting correction maps were then smoothed with a Gaussian kernel of a standard deviation of σ = 5 pixels to reduce the noise caused by small-scale variations. We are aware that this strategy (using overlapping samples and then smoothing the maps) introduces correlations between the corrections in different bins, but, in turn, the resulting smoothed correction maps are simpler, more interpretable, and far less dominated by noise, while maintaining high spatial resolution. The resulting quasar mean proper-motion maps are shown in the left-hand panels of Figure 2 in the right ascension and the declination directions. While the maps show a mean motion close to 0 µas yr−1, they reveal peak-to-peak differences of up to ∼20 µas yr−1 .
As was expected from Lindegren et al. (2021b), the analysis using the DR3 proper motions shows significant improvement over the analysis using the DR2 proper motions. As an example, the right-hand panels of Figure 2 show the corresponding analysis based on the DR2 data7. Not only is the range of corrections broader, reaching peak-to-peak differences of the order of 40 µas yr−1 , but these corrections are systematically and significantly offset from 0 µas yr−1 , with typical values of the order of the expected proper motion of M31 (see Table 1).
The DR3 correction maps can finally be applied as zeropoint offsets to the Gaia proper motions of stars in the Bpm and Rpm samples. This approach is more local than the correction applied by S21, who determined a mean offset over a region of 4 to 20◦ around M31. Applying the method described in Section 2.2 yields ( ) = (44.6 ± 14.9, −29.8 ± 13.1) µas yr−1 for Bpm and (41.3 ± 14.3, −74.8 ± 13.2) µas yr−1 for Rpm . The uncertainties8 were here computed as the quadratic sum of the uncertainty resulting from the inference itself and the mean uncertainty from the inferences on the quasar corrections (9.8 µas yr−1 in the right ascension direction and 8.3 µas yr−1 in the declination direction). These results are similar to those obtained by S21 for the same samples, including the stark difference in the declination direction between the blue and red samples. Despite our more local correction of the mean motion of quasars, this measurement is still plagued by systematics that we now aim to constrain.
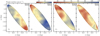 |
Fig. 2 Zero-point offsets for the Gaia stars’ proper motions. Left-hand panels: smoothed maps of the quasar proper motions in the right ascension and the declination directions obtained using Gaia DR3. Right-hand panels: same but using Gaia DR2. |
Proper motion of M31 in the heliocentric reference frame.
3.2 Quadrant analysis
To explore the reliability of the mean proper motion of M31 inferred above, we divided our blue and red samples into four quadrants centred on M31 (delimited by the dashed lines in the central panel of Figure 1), each containing the same number of stars, and then inferred the bulk motion of these smaller but independent samples. Consistent results in the different quadrants would mean that the systematics are folded into the statistical uncertainties, whereas incompatible results between quadrants would imply additional systematics that have not yet been taken into account.
The results for each quadrant are shown as the low-opacity symbols and associated error bars in Figure 3. For this particular quadrant configuration, the results for the blue stars are inconsistent, with one quadrant significantly offset from the three others. As we rotate the quadrants by small steps, we see rapid changes in the individual proper motions, leading to this inconsistency that is not specifically driven by our choice of quadrants. Potential contamination contributing to these inconsistencies is discussed in Section 4.3.
To assess the level of potential systematics in the proper motion inferences, we assume that the results from the four quadrants correspond to four independent measurements of the proper motion of M319, whose PDF on the mean (µα/δ) and dispersion ( ) informs us on the mean proper motion of the considered sample of stars and the unaccounted systematics. Examples of such PDFs are shown in the right-hand panel of Figure 3 for the right ascension proper motion, with the corresponding colours for the blue and red sample of stars.
An estimate of the mean and its statistical uncertainty were obtained from the marginalised PDFs of (µα/δ), while the systematics were determined from the marginalised PDFs of ( ). Conservatively, we chose to determine the systematics on the proper motion as the 90% confidence limit on this parameter. The corresponding values are shown as the dashed error bars in the left-hand panel of Figure 3. The final results, detailing the statistical and systematic uncertainties, are listed in Table 1 and are also displayed in the left-hand panel of Figure 4. In both cases, they are compared to literature values. The offset mentioned throughout this paper, between the blue and red stars, remains in our analysis. However, the systematics dominate the overall uncertainties, rendering the two star samples compatible with one another, which was not the case before (the potential origins of those will be further discussed in Section 4). Moreover, these results are also compatible with the previous estimate of van der Marel et al. (2019), who used Gaia DR2.
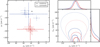 |
Fig. 3 Results of the quadrant analysis on M31. Left-hand panel: results from the quadrant analysis of M31 in the heliocentric frame. In low opacity are shown the inferences obtained for each individual quadrant, while shown clearly are the inferences resulting from the analysis of the 2D space from the right-hand panel. The solid and dashed error bars represent, respectively, the statistical and systematic uncertainties. The black pentagon represents a strictly radial motion in the galactic reference frame. Right-hand panel: example of the 2D PDFs (1, 2 and 3σ) obtained from the quadrant analysis in the direction of the right ascension and their marginalised 1D PDFs. |
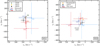 |
Fig. 4 Proper motions of M31 and M33 in the heliocentric reference frame. Left-hand panel: results for M31. The black pentagon represents a strictly radial motion in the galactic reference frame. The yellow dot is the weighted average of the three HST fields corrected for the internal kinematics of M31 (Sohn et al. 2012; van der Marel et al. 2012b). The black dot is the proper motion result based on the DR2 (van der Marel et al. 2019). The blue and red dots are the values derived by Salomon et al. (2021), while the diamonds and squares in different shades of blue and red are the results from this paper using DR3 and DR2, respectively. For our study, the solid error bars represent the statistical uncertainty and the dashed ones the systematic uncertainties. Right-hand panel: results for M33. The orange dot is the water maser weighted average of Brunthaler et al. (2005). The rest of the symbols are the same as in the left-hand panel. |
Proper motion of M33 in the heliocentric reference frame.
3.3 The proper motion of M33
M33 is a companion of M31, located at roughly the same distance (dM33 = 794 ± 24 kpc, from McConnachie et al. 2004). It also shows signs of active star formation (Bastian et al. 2007; Peltonen et al. 2024), which, as in the case of M31, implies the presence of super-giants bright enough to be detected by Gaia. Before Gaia, estimates of the proper motion of M33 had already been made thanks to the presence of two water masers in its disc, IC 133 and M33/19, whose positions could be very accurately followed through interferometric VLBI measurements (Brunthaler et al. 2005). Although we can be highly confident in the precision of these measurements, much like the HST measurements of M31 (performed in small deep fields, Sohn et al. 2012), this estimate may be model-dependent and affected by local peculiar motions. As for the case of M31, an independent measurement, albeit a more uncertain one, was made possible through Gaia DR2 (van der Marel et al. 2019). The results from these previous works are shown in the right-hand panel of Figure 4 as orange and black dots, respectively.
We isolated M33 stars by applying the same cuts as were used for M31. The resulting blue  samples are made of 1992 and 1093 stars, respectively. We corrected for the intrinsic motion of the stars with the flat disc model of Corbelli & Schneider (1997) and then followed the whole procedure described in the previous sections; that is, obtaining quasar correction maps and using them as zero-point offsets to the Gaia proper motions. These maps are very similar to the ones of M31, having mean motions compatible with 0 µas yr−1 (within the uncertainties of each bin inference) and peak-to-peak differences of ∼10 µas yr−1.
The quadrant analysis reveals inconsistencies between the quadrant inferences, similar to those observed for M31, leading to similarly large systematic uncertainties. The final results are displayed in the right-hand panel of Figure 4 and are listed in Table 2. Interestingly, contrary to the case of M31, there is a better agreement between the  samples, which are nearly compatible within their statistical uncertainties. This might be the result of a less contaminated CRF around M33 than around M31, or the analysis being conducted on a smaller area (M33 being smaller). Our results also appear to be mostly consistent with the previous works, displaying an overall proper motion slightly less radial towards the MW than the result found by van der Marel et al. (2019).
4 Discussion
4.1 Summary
We reproduced the results from the study that was made by S21. In order to correct for the background motion of the quasars more locally, we created correction maps, which revealed local differences of ∼10 µas yr−1 (as expected from Lindegren et al. 2021b). Applying these correction maps as zero-point offsets for the stars yields results very similar to the ones previously found, and, despite the corrections, there remains an observed offset between the inferences of the blue and the red samples of stars. This offset is most likely due to systematics present in the Gaia DR3 data.
We show that we are able to assess the level of those systematics from the analysis of the overall inferred motion of different regions of the disc of M31. With a conservative 90% confidence level, these systematics are of the order of 30 µas yr−1 and commensurate with the proper motion of M31 itself. Such large systematics, explained by the spread of results from M31 star sub-samples, help to decipher the observed difference between the blue and red samples of stars, which was first pointed out by S21. These new results render our new estimates entirely compatible with the ones made by van der Marel et al. (2019) (using Gaia DR2) and Sohn et al. (2012) and van der Marel et al. (2012b) (using HST), all of which are displayed in the lefthand panel of Figure 4. No proper motion estimate of M33 had been made using Gaia DR3, but our updated results are consistent with previous works on the topic (see right-hand panel of Figure 4).
Overall, it is of course unsatisfactory to be unable to tightly constrain these systematics, which are large compared to the proper motions of either M31 or M33, but nevertheless very small and close to the accuracy expectations of Gaia. Below, we discuss potential sources that could explain these unaccounted systematics.
4.2 Impact of colour
The strong difference in the inferred proper motion of M31 from the blue and red samples of stars appear to imply that colour could (in part) play a role in the presence of systematics. Lindegren et al. (2021a), in their study of the dependence on colour and magnitude of the parallax systematics in Gaia DR3, point out that, since parallaxes and proper motions are jointly determined, such (small) systematics are likely also present for the Gaia proper motion values. Cantat-Gaudin & Brandt (2021) show that, at the bright end, these are indeed biased, with the biases being a function of the magnitude, the position, and the colour of an object. They estimate that the systematics could be of the order of 10 µas yr−1 for objects that are bluer or redder than the mean colour of Gaia objects. The CMD in the right-hand panel of Figure 1 shows the colour distribution of stars from both samples along with that of the background quasars. It is clear that there is no strong overlap between the different populations, which may explain why, if there is indeed a colour-dependent systematic to the Gaia proper motions over the full magnitude range, the quasar correction did not remove this effect.
4.3 Potential contamination
With the accuracy that we are aiming for, biases may arise from differences between the assumed model and the true distribution of the data. In particular, it is easy to imagine that the presence of a single outlier with small proper motion uncertainties (e.g. a bright contaminating star) may shift the mean inferred proper motion. This shift may be small overall, but might still be comparable to the tiny mean proper motion of M31.
As has already been pointed out by S21, the PAndAS MW stream, located at a distance of ∼17 kpc (Martin et al. 2014) and crossing M31 in its most northern part, overlaps with the blue sample in the CMD for G < 18. However, re-doing the analysis only for stars with G > 18 does not change our conclusions.
We also investigated the intrinsically higher contamination of the red sample that was already mentioned in S21. Using the numerous photometric bands of the PHAT survey (Williams et al. 2014) and, in particular, the (F336W–F475W) versus (F110W–F160W) colour–colour space10, we see a clear separation between stars removed by the proper motion cut and the Rpm sample. We interpret this as the separation between contaminating dwarfs and relevant giants. This separation, if truly discriminating the contaminants from true members, would imply that the 1.8% contamination (from Section 2.1) is underestimated at least by a factor of two, the newly found contamination fraction being of the order of 4% for the Rpm sample. Re-doing the full analysis without these possible contaminants highlighted in the PHAT data barely changes our previous results, the new inference remaining far from the blue inferences.
4.4 Improvements since Gaia DR2 and future prospects
Because we aim for proper motion precision that challenges Gaia’s current capabilities, it is worth checking whether the situation has improved between the DR2 and the DR3. To this end, when available, we extracted the DR2 proper motions for the quasar, the Bpm and Rpm samples built in Section 2.1. We then performed the full analysis on this new DR2-based dataset. The right-hand panels of Figure 2 show the corresponding quasar correction maps, which, as was already mentioned in Section 3.1, are significantly worse than for DR3: not only are the corrections no longer centred on ∼0 µas yr−1, but the full amplitude of corrections spans ∼40 µas yr−1 (vs. ∼0 µas yr−1 and ∼20 µas yr−1, respectively, for DR3). The quadrant inconsistencies are larger than for the DR3 analysis, implying larger final systematic uncertainties reaching ∼90 µas yr−1, two to three times larger than for the DR3 analysis (see Table 1). In Figure 4, we see that these results have statistical uncertainties comparable to the ones from van der Marel et al. (2019). However, we see that the model’s favoured values are very different and are only compatible because of the large systematic uncertainties. We observe the same trend for M33, where the results using DR2 are way more uncertain than the ones using DR3.
As is noted by Lindegren et al. (2021b), the proper motion uncertainties should decrease over time as T−3/2; that is, by a factor of 0.51 between DR2 (22 months of data) and DR3 (34 months of data). It is reassuring to observe this refinement in our results, both for the statistical and systematic uncertainties. If a similar improvement is achieved between DR3 and DR4, the proper motion uncertainties should be reduced by nearly a factor of 3. We hope this will help resolve the discrepancies between the blue and red star samples. We also anticipate the possibility of reaching systematic uncertainties comparable to the ∼12 µas yr−1 reached by HST (in Sohn et al. 2012; van der Marel et al. 2012b), but over a sample of stars covering the entire extent of M31. Re-evaluating the proper motions of M31 and M33 with DR4 could further constrain their dynamics, allowing for studies of their orbital history to be compared with thorough past works (e.g. van der Marel et al. 2012a; Patel et al. 2017).
Acknowledgements
This work has made use of data from the European Space Agency (ESA) mission Gaia (https://www.cosmos.esa.int/gaia), processed by the Gaia Data Processing and Analysis Consortium (DPAC, https://www.cosmos.esa.int/web/gaia/dpac/consortium). Funding for the DPAC has been provided by national institutions, in particular the institutions participating in the Gaia Multilateral Agreement.
References
- Bastian, N., Ercolano, B., Gieles, M., et al. 2007, MNRAS, 379, 1302 [NASA ADS] [CrossRef] [Google Scholar]
- Brunthaler, A., Reid, M. J., Falcke, H., Greenhill, L. J., & Henkel, C. 2005, Science, 307, 1440 [NASA ADS] [CrossRef] [Google Scholar]
- Cantat-Gaudin, T., & Brandt, T. D. 2021, A&A, 649, A124 [NASA ADS] [CrossRef] [EDP Sciences] [Google Scholar]
- Chemin, L., Carignan, C., & Foster, T. 2009, ApJ, 705, 1395 [NASA ADS] [CrossRef] [Google Scholar]
- Corbelli, E., & Schneider, S. E. 1997, ApJ, 479, 244 [NASA ADS] [CrossRef] [Google Scholar]
- Gaia Collaboration (Brown, A. G. A., et al.) 2021, A&A, 649, A1 [NASA ADS] [CrossRef] [EDP Sciences] [Google Scholar]
- Gaia Collaboration (Klioner, S. A., et al.) 2022, A&A, 667, A148 [NASA ADS] [CrossRef] [EDP Sciences] [Google Scholar]
- Gaia Collaboration (Bailer-Jones, C. A. L., et al.) 2023a, A&A, 674, A41 [NASA ADS] [CrossRef] [EDP Sciences] [Google Scholar]
- Gaia Collaboration (Vallenari, A., et al.) 2023b, A&A, 674, A1 [NASA ADS] [CrossRef] [EDP Sciences] [Google Scholar]
- Hastings, W. K. 1970, Biometrika, 57, 97 [Google Scholar]
- Hernitschek, N., Schlafly, E. F., Sesar, B., et al. 2016, ApJ, 817, 73 [Google Scholar]
- Ibata, R. A., Lewis, G. F., Conn, A. R., et al. 2013, Nature, 493, 62 [NASA ADS] [CrossRef] [Google Scholar]
- Kahn, F. D., & Woltjer, L. 1959, ApJ, 130, 705 [NASA ADS] [CrossRef] [Google Scholar]
- Lewis, A. R., Dolphin, A. E., Dalcanton, J. J., et al. 2015, ApJ, 805, 183 [NASA ADS] [CrossRef] [Google Scholar]
- Li, Y.-S., & White, S. D. M. 2008, MNRAS, 384, 1459 [CrossRef] [Google Scholar]
- Lindegren, L., Bastian, U., Biermann, M., et al. 2021a, A&A, 649, A4 [EDP Sciences] [Google Scholar]
- Lindegren, L., Klioner, S. A., Hernández, J., et al. 2021b, A&A, 649, A2 [EDP Sciences] [Google Scholar]
- Martin, N. F., Ibata, R. A., Rich, R. M., et al. 2014, ApJ, 787, 19 [Google Scholar]
- McConnachie, A. W., Irwin, M. J., Ferguson, A. M. N., et al. 2004, MNRAS, 350, 243 [NASA ADS] [CrossRef] [Google Scholar]
- McConnachie, A. W., Irwin, M. J., Ferguson, A. M. N., et al. 2005, MNRAS, 356, 979 [NASA ADS] [CrossRef] [Google Scholar]
- Metropolis, N., Rosenbluth, A. W., Rosenbluth, M. N., Teller, A. H., & Teller, E. 1953, J. Chem. Phys., 21, 1087 [Google Scholar]
- Patel, E., Besla, G., & Sohn, S. T. 2017, MNRAS, 464, 3825 [NASA ADS] [CrossRef] [Google Scholar]
- Peltonen, J., Rosolowsky, E., Williams, T. G., et al. 2024, MNRAS, 527, 10668 [Google Scholar]
- Peñarrubia, J., Gómez, F. A., Besla, G., Erkal, D., & Ma, Y.-Z. 2016, MNRAS, 456, L54 [CrossRef] [Google Scholar]
- Salomon, J. B., Ibata, R. A., Famaey, B., Martin, N. F., & Lewis, G. F. 2016, MNRAS, 456, 4432 [CrossRef] [Google Scholar]
- Salomon, J. B., Ibata, R., Reylé, C., et al. 2021, MNRAS, 507, 2592 [NASA ADS] [Google Scholar]
- Sohn, S. T., Anderson, J., & van der Marel, R. P. 2012, ApJ, 753, 7 [NASA ADS] [CrossRef] [Google Scholar]
- van der Marel, R. P., & Guhathakurta, P. 2008, ApJ, 678, 187 [CrossRef] [Google Scholar]
- van der Marel, R. P., Besla, G., Cox, T. J., Sohn, S. T., & Anderson, J. 2012a, ApJ, 753, 9 [NASA ADS] [CrossRef] [Google Scholar]
- van der Marel, R. P., Fardal, M., Besla, G., et al. 2012b, ApJ, 753, 8 [NASA ADS] [CrossRef] [Google Scholar]
- van der Marel, R. P., Fardal, M. A., Sohn, S. T., et al. 2019, ApJ, 872, 24 [NASA ADS] [CrossRef] [Google Scholar]
- Williams, B. F., Lang, D., Dalcanton, J. J., et al. 2014, ApJS, 215, 9 [Google Scholar]

Specifically, we select Gaia quasar candidates flagged as astrometric_selection_flag == 1, i.e. that have been identified with an estimated purity of 98% in Gaia Collaboration (2023a).
We also checked the quasar catalogue of Hernitschek et al. (2016) based on the Pan-STARRS1 photometric variability of sources. Selecting likely quasars (p_QSO>0.5) leads to no additional sources compared to quasars already added from the Gaia extragalactic catalogue.
We find only 23,139 DR2 counterparts to our DR3-based quasar sample, with the difference arising from the intrinsically more complete DR3 dataset (see Gaia Collaboration 2021).
As already mentioned above in Section 3.1, this is not entirely accurate due to the correlations introduced by our method of constructing the quasar correction maps and subsequently smoothed them.
All Tables
All Figures
|
Fig. 1 Spatial and CMD locations of stars and quasars around M31. Left-hand panel: quasars from the Gaia CRF3 (in grey) and added by the latest Gaia catalogue of extra-galactic objects (in black) centred on M31. Middle panel: final blue and red samples of M31 stars superimposed on the central ellipse representing the geometrical cut made on M31. Each quadrant depicted by dashed lines contains the same number of blue stars and the hatched region is used to estimate the properties of the contamination. Right-hand panel: CMD of all the objects from the previous panels. |
| In the text | |
|
Fig. 2 Zero-point offsets for the Gaia stars’ proper motions. Left-hand panels: smoothed maps of the quasar proper motions in the right ascension and the declination directions obtained using Gaia DR3. Right-hand panels: same but using Gaia DR2. |
| In the text | |
|
Fig. 3 Results of the quadrant analysis on M31. Left-hand panel: results from the quadrant analysis of M31 in the heliocentric frame. In low opacity are shown the inferences obtained for each individual quadrant, while shown clearly are the inferences resulting from the analysis of the 2D space from the right-hand panel. The solid and dashed error bars represent, respectively, the statistical and systematic uncertainties. The black pentagon represents a strictly radial motion in the galactic reference frame. Right-hand panel: example of the 2D PDFs (1, 2 and 3σ) obtained from the quadrant analysis in the direction of the right ascension and their marginalised 1D PDFs. |
| In the text | |
|
Fig. 4 Proper motions of M31 and M33 in the heliocentric reference frame. Left-hand panel: results for M31. The black pentagon represents a strictly radial motion in the galactic reference frame. The yellow dot is the weighted average of the three HST fields corrected for the internal kinematics of M31 (Sohn et al. 2012; van der Marel et al. 2012b). The black dot is the proper motion result based on the DR2 (van der Marel et al. 2019). The blue and red dots are the values derived by Salomon et al. (2021), while the diamonds and squares in different shades of blue and red are the results from this paper using DR3 and DR2, respectively. For our study, the solid error bars represent the statistical uncertainty and the dashed ones the systematic uncertainties. Right-hand panel: results for M33. The orange dot is the water maser weighted average of Brunthaler et al. (2005). The rest of the symbols are the same as in the left-hand panel. |
| In the text | |
Current usage metrics show cumulative count of Article Views (full-text article views including HTML views, PDF and ePub downloads, according to the available data) and Abstracts Views on Vision4Press platform.
Data correspond to usage on the plateform after 2015. The current usage metrics is available 48-96 hours after online publication and is updated daily on week days.
Initial download of the metrics may take a while.