Fig. 6
Download original image
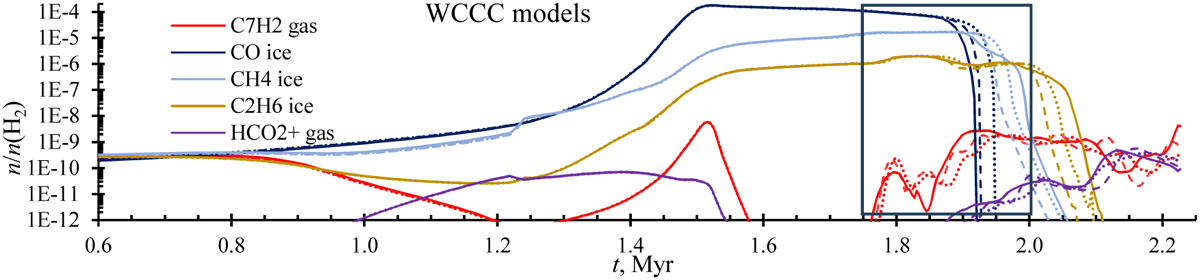
Correlation of an example WCCC molecule C7H2 with an evaporation of C-containing ices CO, CH4, and C2 H6. The solid lines show Model M-1/6WCCC, the dashed lines show M0WCCC, and the dotted lines show M1/6WCCC. The box at t = 1.8...2.1 Myr (Tgas = 20...70 K) outlines the window with C-chain abundance peaks, which is most relevant for WCCC with this model.
Current usage metrics show cumulative count of Article Views (full-text article views including HTML views, PDF and ePub downloads, according to the available data) and Abstracts Views on Vision4Press platform.
Data correspond to usage on the plateform after 2015. The current usage metrics is available 48-96 hours after online publication and is updated daily on week days.
Initial download of the metrics may take a while.