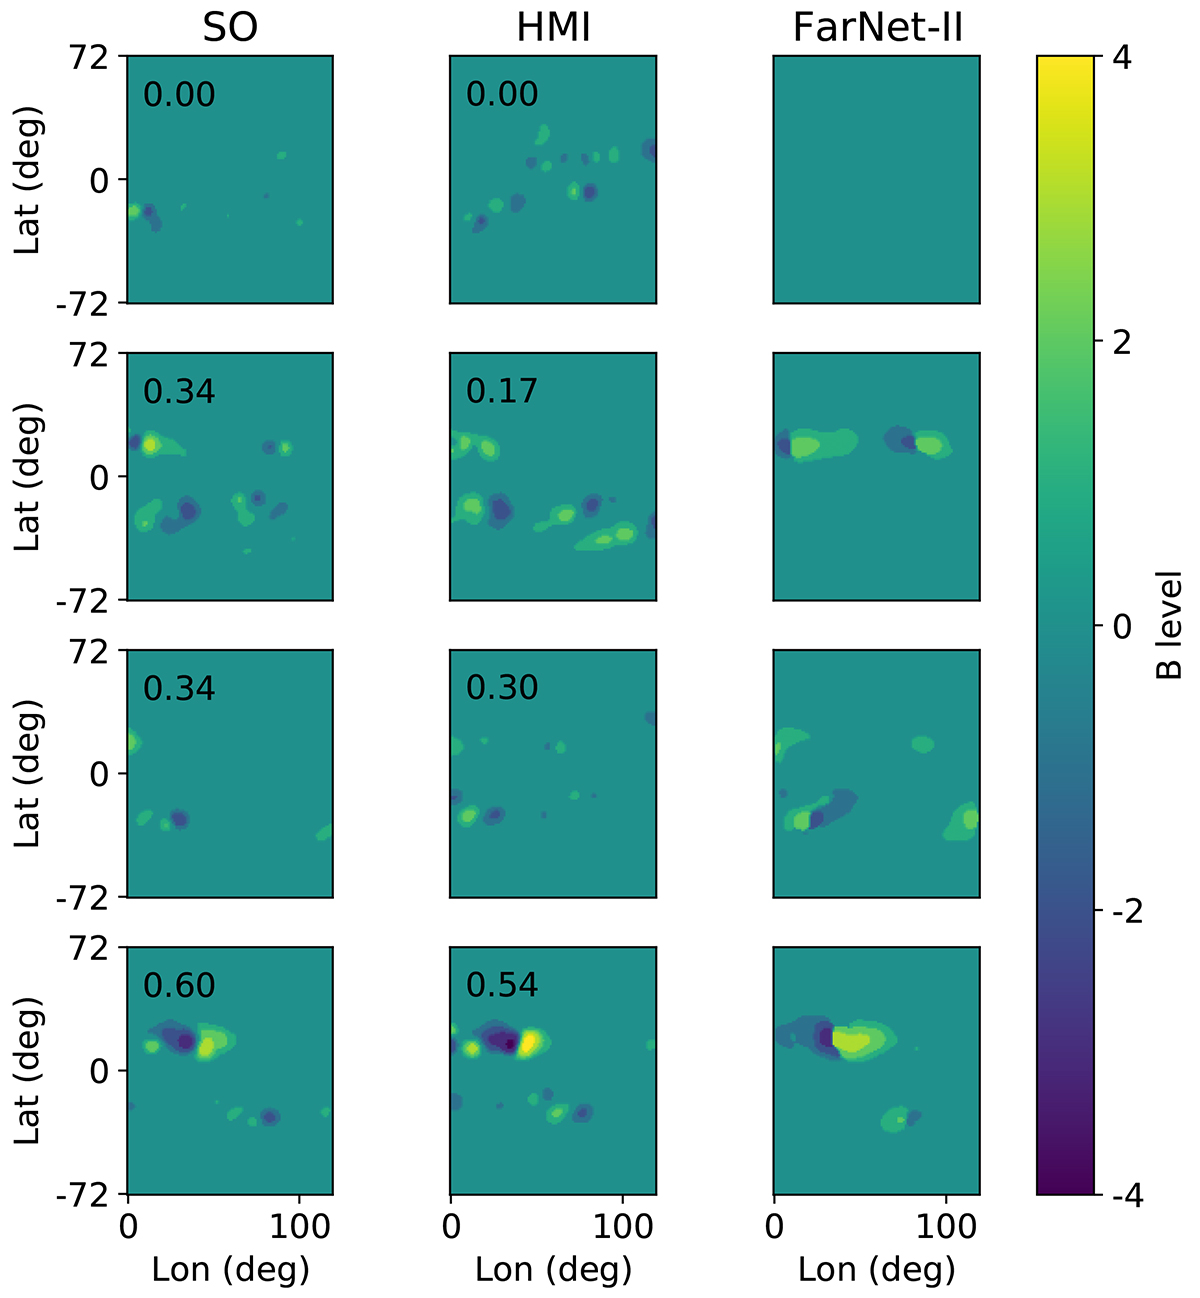
Fig. 9.
Download original image
Comparisons between the FarNet-II outputs (last column), HMI magnetogram masks from 13.5 days later (second column), and Solar Orbiter (SO in the figure) far-side magnetogram masks taken at the time of the network outputs (first column). The number in the upper left corner indicates the volumetric Dice calculated for each specific mask and the FarNet-II output for the corresponding date.
Current usage metrics show cumulative count of Article Views (full-text article views including HTML views, PDF and ePub downloads, according to the available data) and Abstracts Views on Vision4Press platform.
Data correspond to usage on the plateform after 2015. The current usage metrics is available 48-96 hours after online publication and is updated daily on week days.
Initial download of the metrics may take a while.