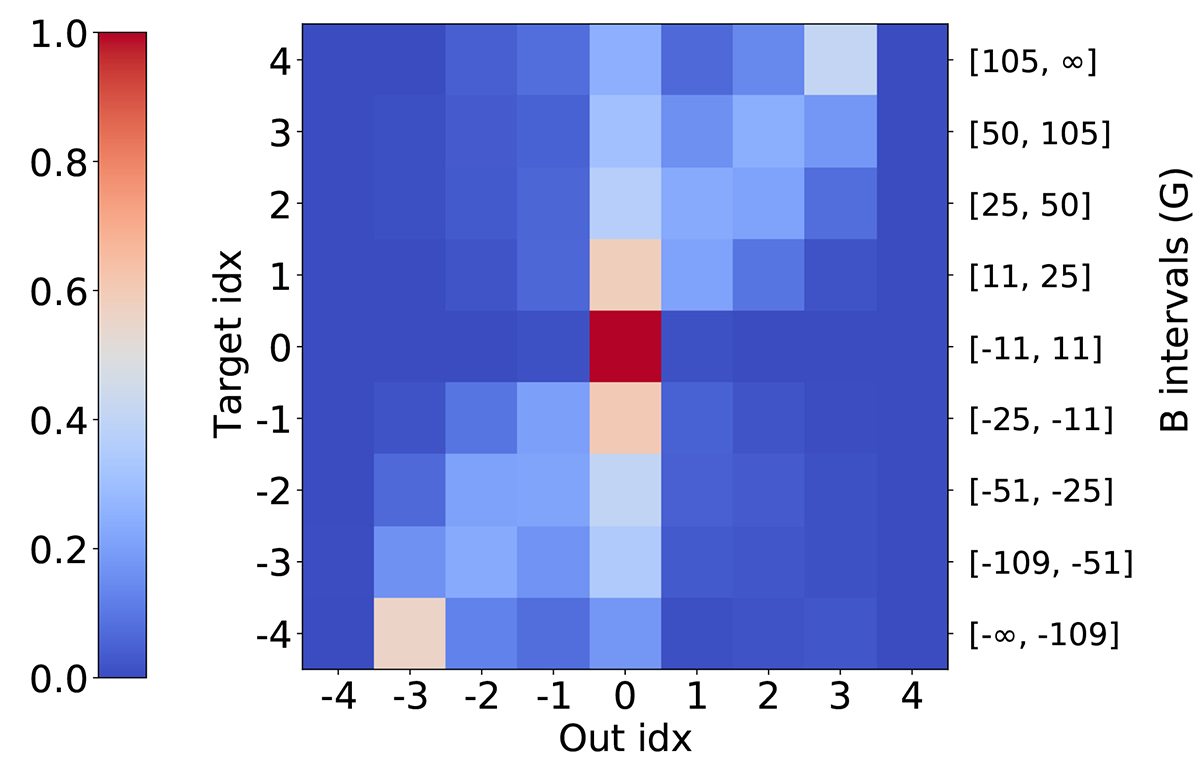
Fig. 7.
Download original image
Fraction of pixels from each magnetic level of the targets assigned to each magnetic level of the outputs. The values are normalized to the total number of pixels of this subset assigned to each level of the targets. The right y-axis shows the magnetic field intervals associated with each level. The exact limits for the magnetic field range of each level are shown in Table 1.
Current usage metrics show cumulative count of Article Views (full-text article views including HTML views, PDF and ePub downloads, according to the available data) and Abstracts Views on Vision4Press platform.
Data correspond to usage on the plateform after 2015. The current usage metrics is available 48-96 hours after online publication and is updated daily on week days.
Initial download of the metrics may take a while.