Fig. 3.
Download original image
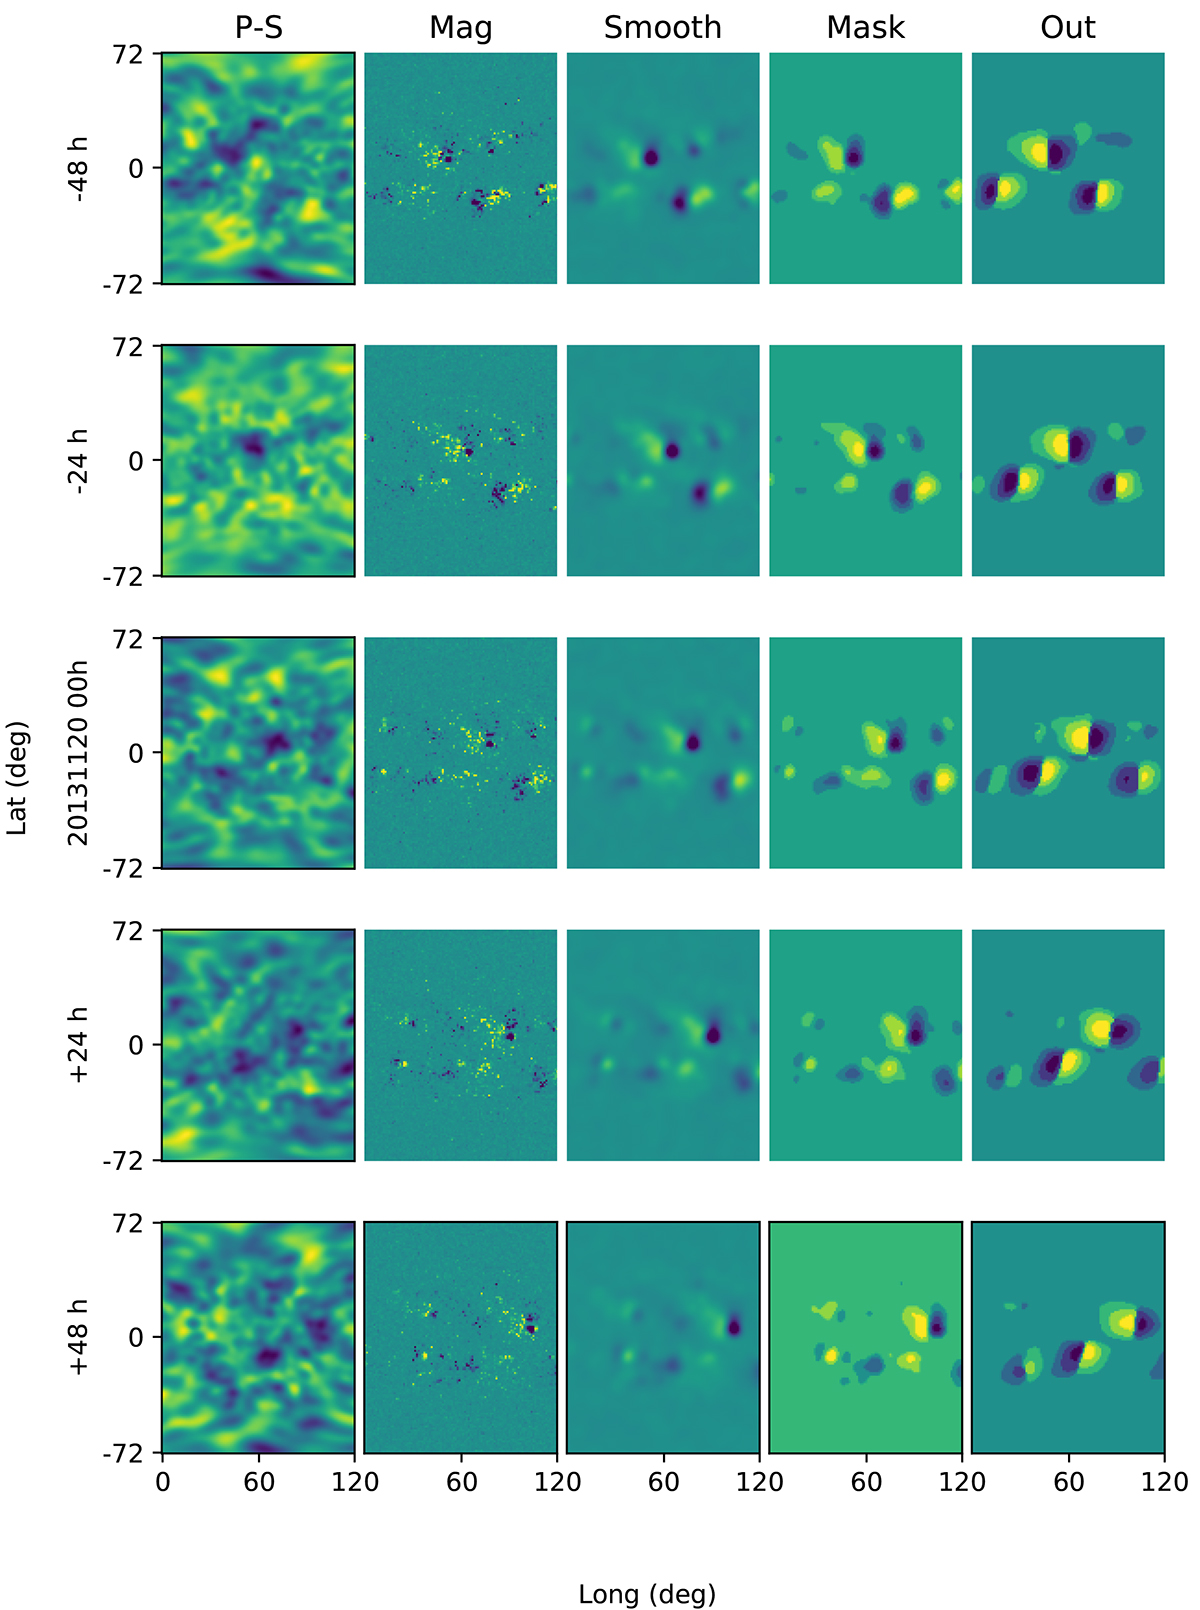
Representation of FarNet-II predictions for activity in a sequence centered on November 20, 2013. Only 5 of the 11 elements of the sequence are shown, with a cadence of 24 hours. The first column shows the phase-shift maps we used as inputs of the network. The second column shows the related near-side magnetogram, 13.5 days later. The third column shows the smoothed magnetograms. The fourth column shows the mask and targets of the training (binned magnetograms), and the last column shows the FarNet-II outputs.
Current usage metrics show cumulative count of Article Views (full-text article views including HTML views, PDF and ePub downloads, according to the available data) and Abstracts Views on Vision4Press platform.
Data correspond to usage on the plateform after 2015. The current usage metrics is available 48-96 hours after online publication and is updated daily on week days.
Initial download of the metrics may take a while.