Fig. 2.
Download original image
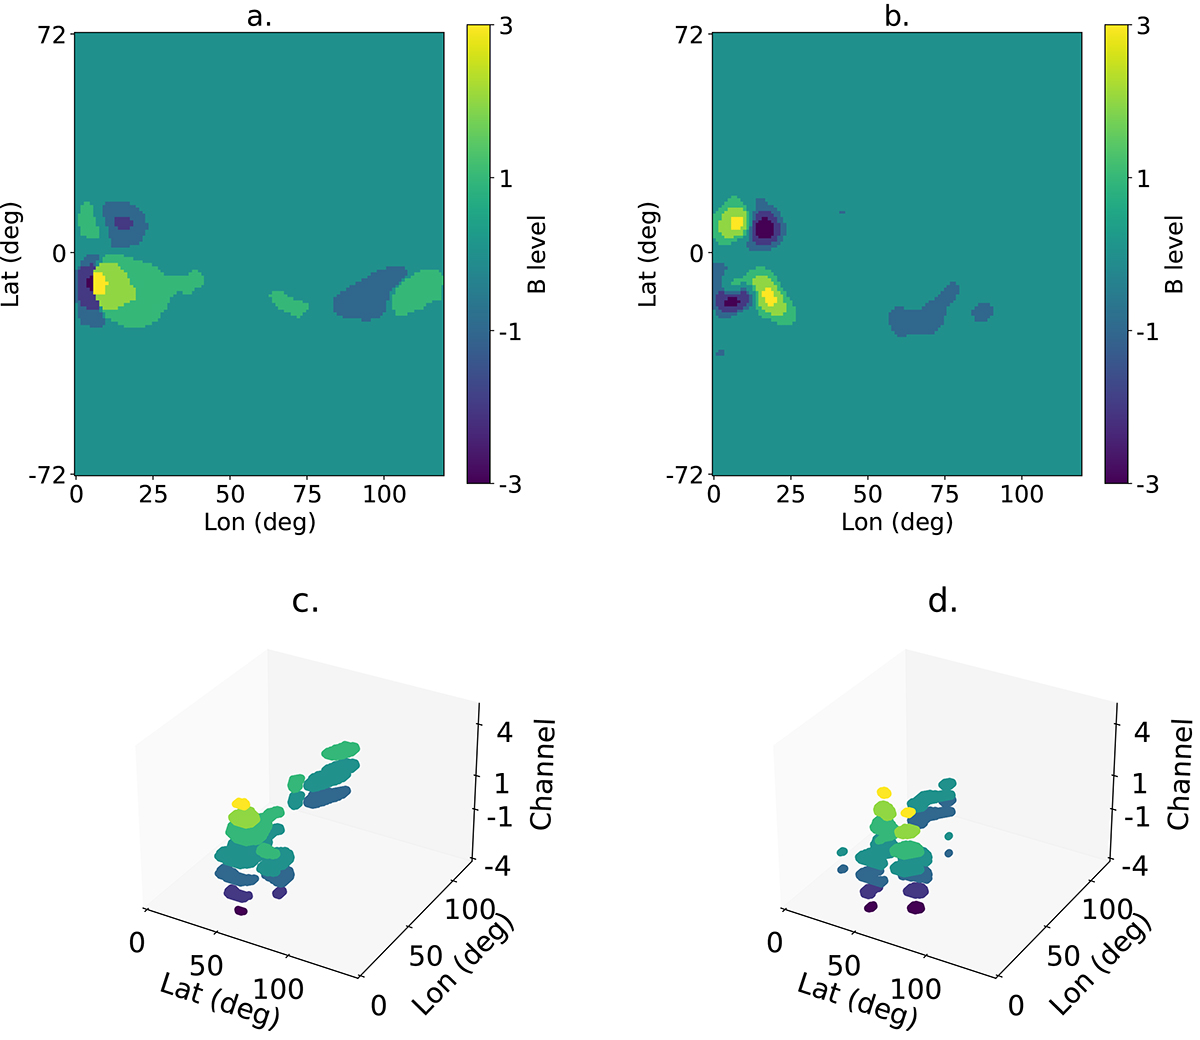
Example of volumetric processing for the output of FarNet-II to evaluate their posterior similarity. Panel a shows the output magnetogram of FarNet-II for January 30, 2014. Panel b shows the corresponding target magnetogram. Panels c and d show the volumetric representations of the output and the target magnetograms, respectively.
Current usage metrics show cumulative count of Article Views (full-text article views including HTML views, PDF and ePub downloads, according to the available data) and Abstracts Views on Vision4Press platform.
Data correspond to usage on the plateform after 2015. The current usage metrics is available 48-96 hours after online publication and is updated daily on week days.
Initial download of the metrics may take a while.