Fig. 8
Download original image
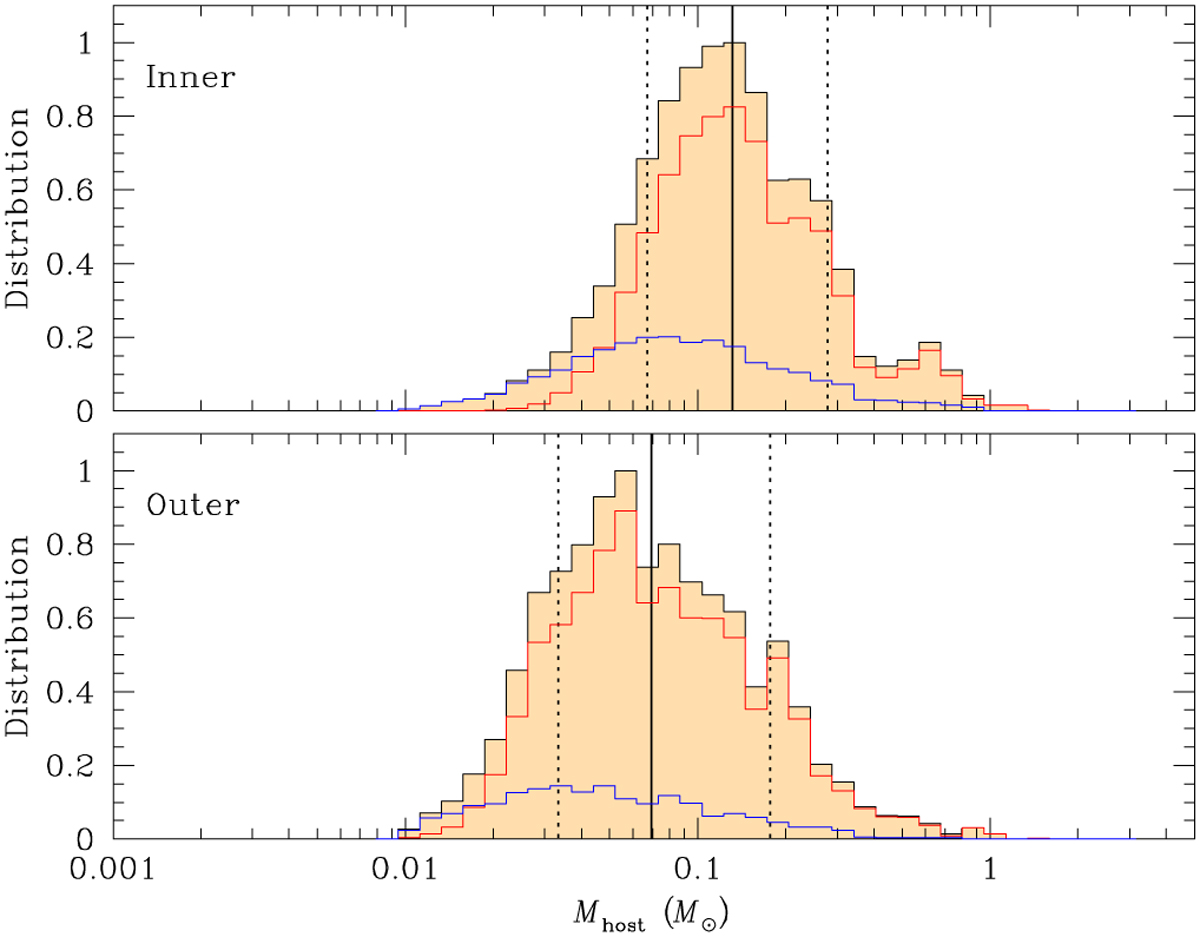
Bayesian posteriors for the host mass of the planetary system KMT-2024-BLG-1044L. The distributions shown in the upper and lower panels are based on the inner and outer solutions, respectively. In each panel, the vertical solid line indicates the median value of the distribution, while the two dotted vertical lines denote the 1σ range. The distributions, depicted in blue and red, represent the contributions from the disc and bulge lens populations, respectively. The black curve represents the sum of these two contributions.
Current usage metrics show cumulative count of Article Views (full-text article views including HTML views, PDF and ePub downloads, according to the available data) and Abstracts Views on Vision4Press platform.
Data correspond to usage on the plateform after 2015. The current usage metrics is available 48-96 hours after online publication and is updated daily on week days.
Initial download of the metrics may take a while.