Fig. 4
Download original image
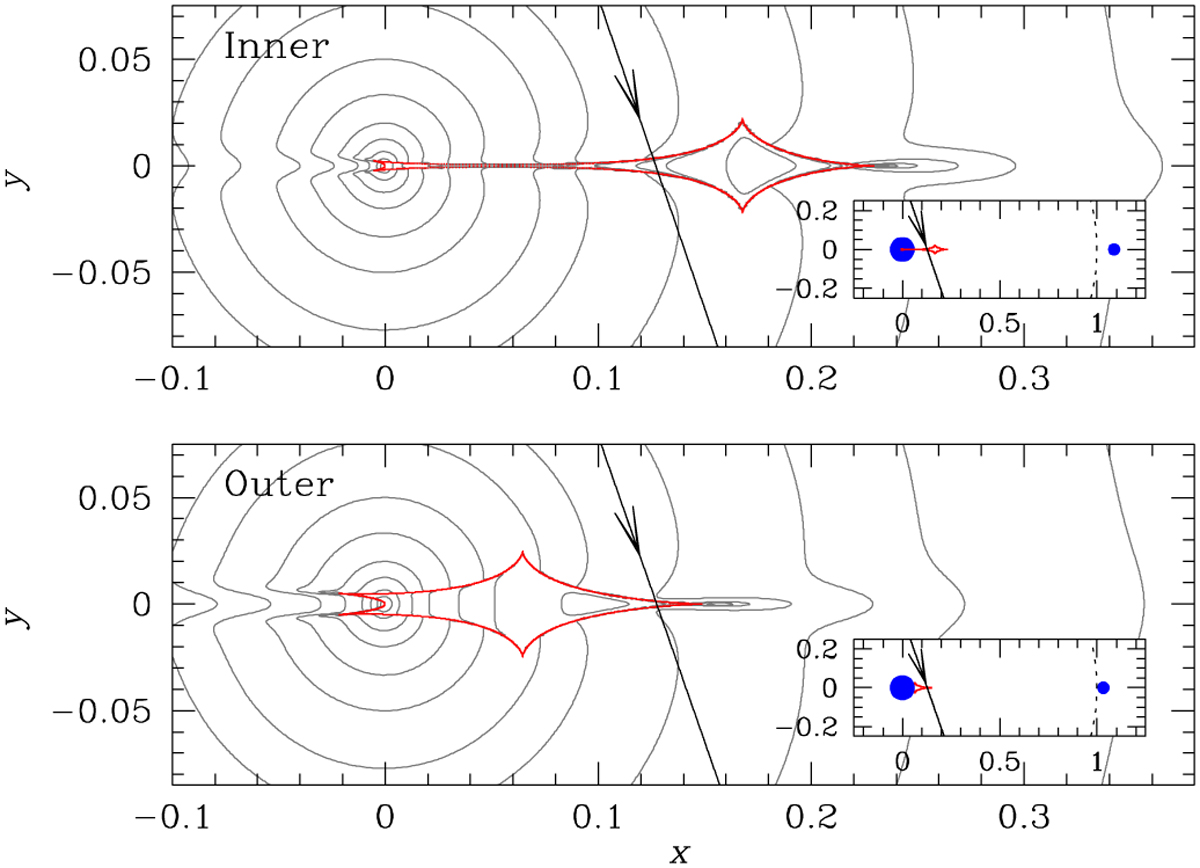
Configurations of the inner and outer solutions. In each panel, the red figure depicts the caustic, and the arrowed line represents the source trajectory. The grey curves surrounding the caustic indicate the equi-magnification contours. The inset provides a zoomed-out view showing the positions of the lens components, denoted by blue dots. The dotted curve in the inset illustrates the Einstein ring.
Current usage metrics show cumulative count of Article Views (full-text article views including HTML views, PDF and ePub downloads, according to the available data) and Abstracts Views on Vision4Press platform.
Data correspond to usage on the plateform after 2015. The current usage metrics is available 48-96 hours after online publication and is updated daily on week days.
Initial download of the metrics may take a while.