Fig. 5
Download original image
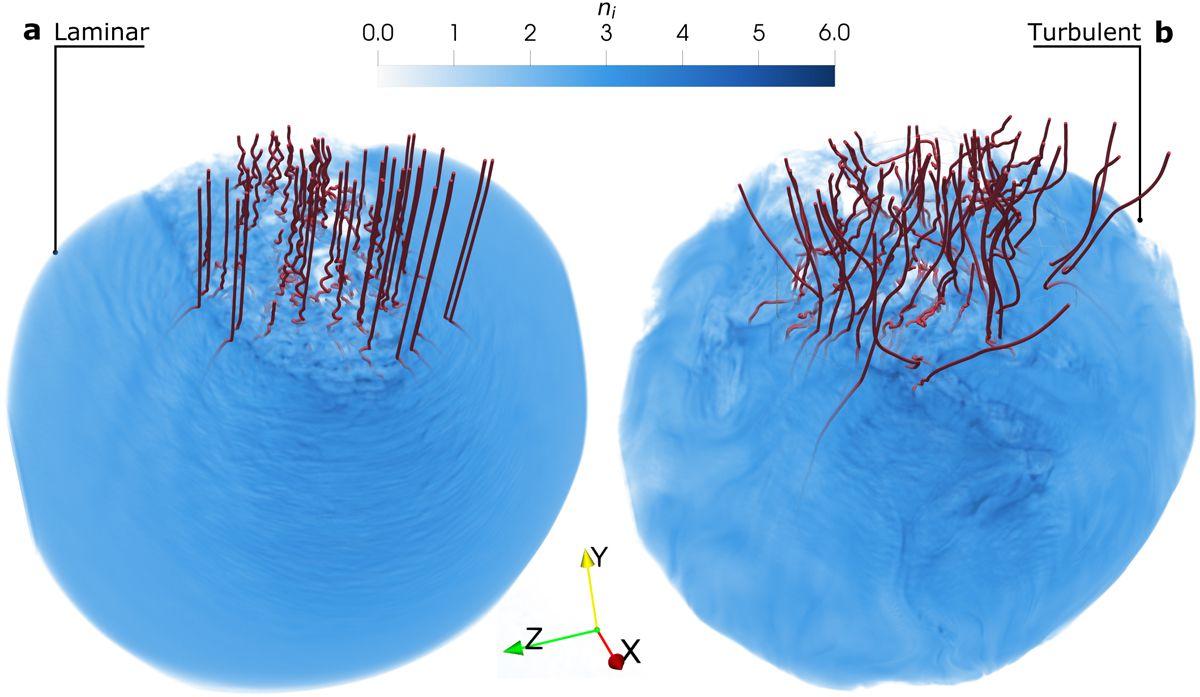
Three-dimensional rendering of the bow shock for the (a) laminar and (b) turbulent solar wind cases. Ion density is represented in blue hues. A threshold density of nth = 101/4n0 is applied, such that all regions in which ni < nth are made transparent. A linear transparency profile is applied from ni = nth to ni = 6n0, and so low-density regions are more transparent than high-density ones. Upstream magnetic field lines crossing the ion foreshock regions are drawn in red.
Current usage metrics show cumulative count of Article Views (full-text article views including HTML views, PDF and ePub downloads, according to the available data) and Abstracts Views on Vision4Press platform.
Data correspond to usage on the plateform after 2015. The current usage metrics is available 48-96 hours after online publication and is updated daily on week days.
Initial download of the metrics may take a while.