Fig. 4
Download original image
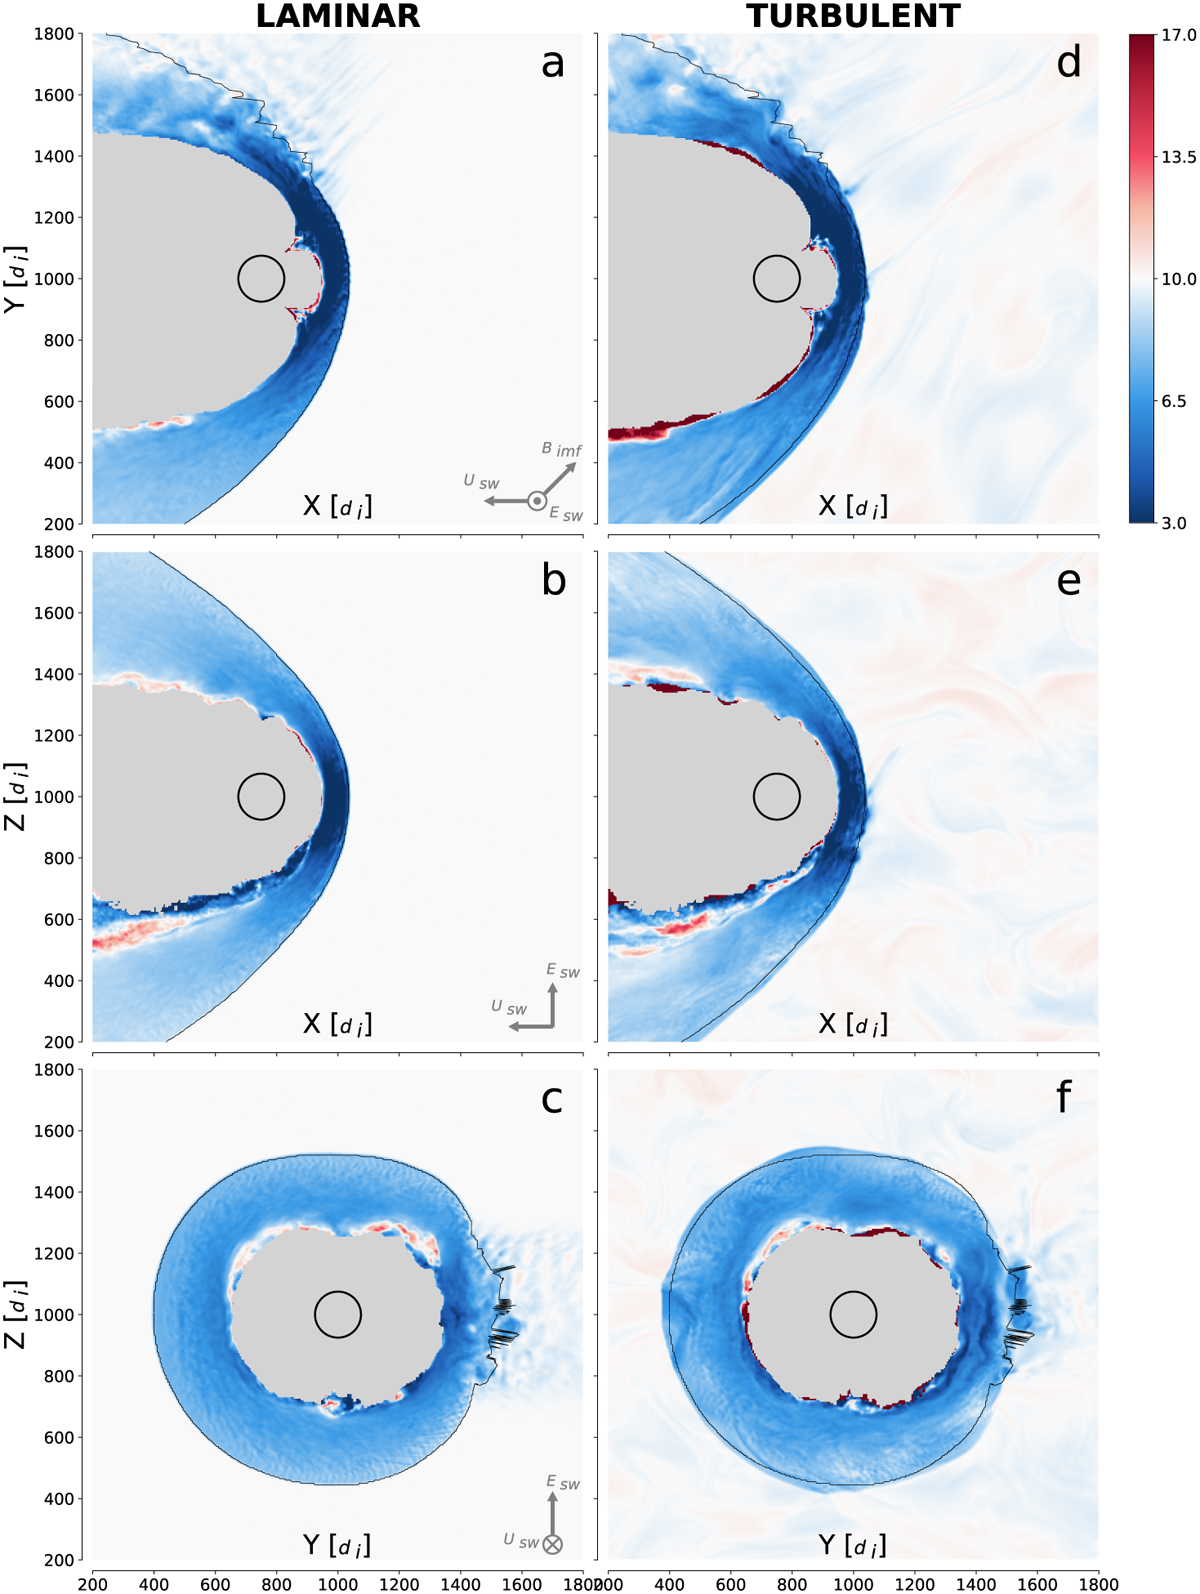
Comparison of the proton bulk speed Up between laminar (left column) and turbulent solar wind simulations (right column) at ![]() . We note that the color scale is linear for clarity, unlike in Figs. 2 and 3. The same format as that in Fig. 2 is used, with the color bar in units of Alfvén speed CA, where white represents the solar-wind speed (Usw = 10 CA). We note that the bulk speeds are expressed in the planet’s reference frame here. Gray regions are those where the plasma density is smaller than 0.1n0
. We note that the color scale is linear for clarity, unlike in Figs. 2 and 3. The same format as that in Fig. 2 is used, with the color bar in units of Alfvén speed CA, where white represents the solar-wind speed (Usw = 10 CA). We note that the bulk speeds are expressed in the planet’s reference frame here. Gray regions are those where the plasma density is smaller than 0.1n0
Current usage metrics show cumulative count of Article Views (full-text article views including HTML views, PDF and ePub downloads, according to the available data) and Abstracts Views on Vision4Press platform.
Data correspond to usage on the plateform after 2015. The current usage metrics is available 48-96 hours after online publication and is updated daily on week days.
Initial download of the metrics may take a while.