Fig. 8
Download original image
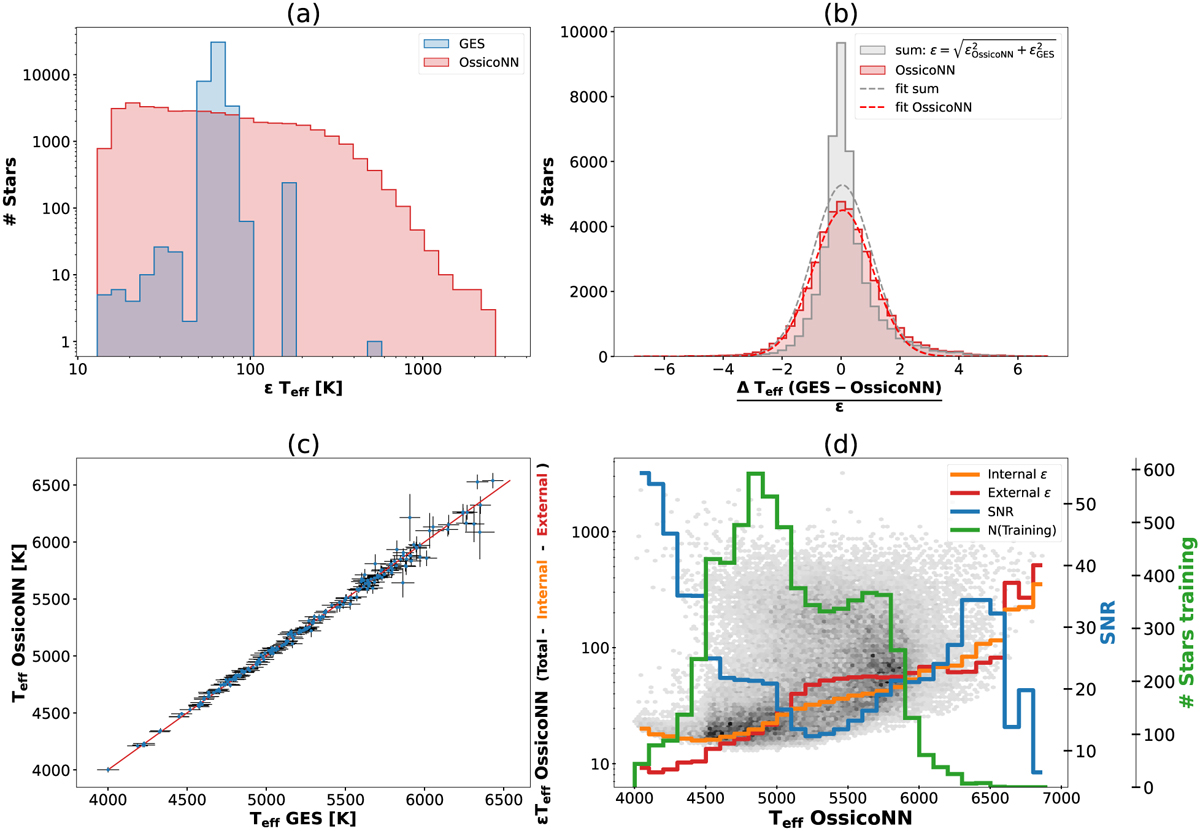
Different plot for effective temperature uncertainties in the ‘Reduced Catalogue dataset’ (totalling 42 738 stars), (a) Distribution of uncertainties in GES and OssicoNN. (b) Distribution of the residuals between OssicoNN and GES normalised with respect to the uncertainties of OssicoNN (red shadowed area) and the sum in quadrature of GES and OssicoNN errors (grey shadowed area). Dashed lines represent the fit of the distribution with a Gaussian function with standard deviation σ = 1. (c) Temperature estimates for 200 stars taken at random from the catalogue by GES and OssicoNN with their respective uncertainties, (d) Density distribution of total OssicoNN uncertainties with respect to inferred temperature. The red and orange lines represent the median external and internal uncertainties for each temperature bin. The blue curve and its scale on the right represent the median S/N per temperature bin.
Current usage metrics show cumulative count of Article Views (full-text article views including HTML views, PDF and ePub downloads, according to the available data) and Abstracts Views on Vision4Press platform.
Data correspond to usage on the plateform after 2015. The current usage metrics is available 48-96 hours after online publication and is updated daily on week days.
Initial download of the metrics may take a while.