Fig. 7
Download original image
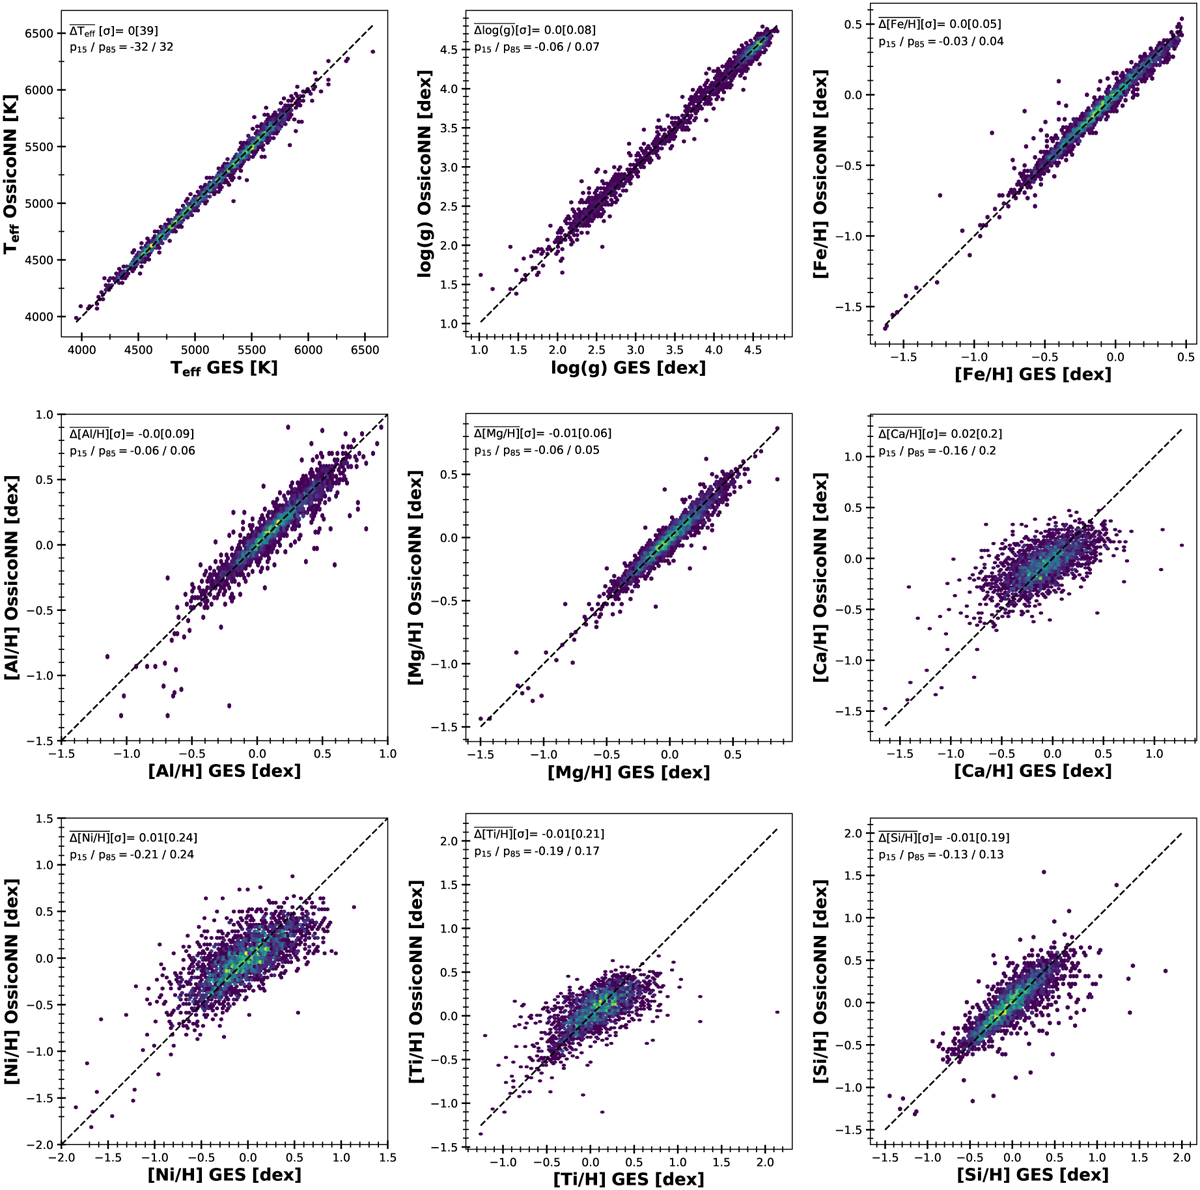
Density distribution of parameters inferred by GES and OssicoNN for the noisy dataset. The average bias and the standard deviation, the 15th percentile, and 85th percentile of the residue results around the 1:1 relation are given in every panel. Dashed diagonal lines indicate the 1:1 relation. For the sake of clarity, we have excluded three stars from the [Si/H] quadrant that deviate significantly from the expected 1:1 relationship. These particular stars were initially predicted to have abundances of 3.1, 3.7, and 4.5 in the GES model. However, when using OssicoNN, their predicted abundances were notably different, measuring only −0.3, 0.2, and 0.2.
Current usage metrics show cumulative count of Article Views (full-text article views including HTML views, PDF and ePub downloads, according to the available data) and Abstracts Views on Vision4Press platform.
Data correspond to usage on the plateform after 2015. The current usage metrics is available 48-96 hours after online publication and is updated daily on week days.
Initial download of the metrics may take a while.