| Issue |
A&A
Volume 692, December 2024
|
|
|---|---|---|
| Article Number | A252 | |
| Number of page(s) | 10 | |
| Section | Interstellar and circumstellar matter | |
| DOI | https://doi.org/10.1051/0004-6361/202450958 | |
| Published online | 17 December 2024 | |
Influence of the C + H2O → H2CO solid-state reaction on astrochemical networks and the formation of complex organic molecules
1
Analytical Mineralogy Group, Institute of Geosciences, Friedrich Schiller University Jena,
Jena,
Germany
2
Departments of Astronomy & Chemistry, University of Virginia,
Charlottesville,
VA,
USA
★ Corresponding authors; This email address is being protected from spambots. You need JavaScript enabled to view it.
; This email address is being protected from spambots. You need JavaScript enabled to view it.
Received:
1
June
2024
Accepted:
16
November
2024
Abstract
Context. The solid-state reaction C + H2O → H2CO has recently been studied experimentally and claimed as a new ‘non-energetic’ pathway to complex organic and prebiotic molecules in cold astrophysical environments.
Aims. We compared results of astrochemical network modelling with and without the C + H2O surface reaction.
Methods. A typical, generic collapse model in which a dense core forms from initially diffuse conditions was used along with the astrochemical kinetics model MAGICKAL.
Results. The inclusion of the reaction does not notably enhance the abundance of formaldehyde itself; however, it significantly enhances the abundance of methanol (formed by the hydrogenation of formaldehyde) on the dust grains at early times, when the high gas-phase abundance of atomic C leads to relatively rapid adsorption onto the grain surfaces. As a result, the gas-phase abundance of methanol is also increased due to chemical desorption, quickly reaching abundances close to ∼10−9 nH, which decline strongly under late-time, high-density conditions. The reaction also influences the abundances of simple ice species, with the CO2 abundance increased in the earliest, deepest ice layers, while the water-ice abundance is somewhat depressed. The abundances of various complex organic molecules are also affected, with some species becoming more abundant and others less. When gas-phase atomic carbon becomes depleted, the grain-surface chemistry returns to behaviour that would be expected if there had been no new reaction.
Conclusions. Our results show that fundamental reactions involving the simplest atomic and molecular species can be of great importance for the evolution of astrochemical reaction networks, thus providing motivation for future experimental and theoretical studies.
Key words: astrochemistry / molecular processes / ISM: abundances / ISM: atoms / ISM: molecules
© The Authors 2024
 Open Access article, published by EDP Sciences, under the terms of the Creative Commons Attribution License (https://creativecommons.org/licenses/by/4.0), which permits unrestricted use, distribution, and reproduction in any medium, provided the original work is properly cited.
This article is published in open access under the Subscribe to Open model. This email address is being protected from spambots. You need JavaScript enabled to view it. to support open access publication.
1 Introduction
The formation of complex organic molecules (COMs) in various astrophysical environments, such as cold pre-stellar cores, hot molecular cores and corinos, and protoplanetary disks, has over the past several decades become a major topic of study across the fields of observational astronomy, laboratory astrophysics, and astrochemical modelling. This is not least because of the chemical links between COMs and prebiotic species, the building blocks of biological molecules necessary for life as we know it. Prebiotic molecules, such as amino acids and nucleobases – while not yet detected in interstellar space – could be synthesised, either in tandem with or as products of the detected molecules, during the star- and planetformation process (Arumainayagam et al. 2019; Jorgensen et al. 2020; Sandford et al. 2020; Öberg & Bergin 2021; Potapov & McCoustra 2021) and then delivered to the early Earth by asteroids and comets. This hypothesis is supported by the detections of prebiotic species in comets and meteorites (Cronin & Chang 1993; Elsila et al. 2009; Cobb & Pudritz 2014; Altwegg et al. 2016). Determining the origins and chemical evolution of COMs in interstellar clouds and star-forming cores may therefore lead to a better understanding of the processes underpinning the appearance of life on Earth.
Importantly, while the detection of COMs, especially saturated organics, was for a long time confined to hot, starforming regions in which dust-grain ice mantles were assumed to have completely sublimated into gas, more recent observations reveal COM production during the much colder, earlier stages of the star-formation process. Modest amounts of dimethyl ether (CH3 OCH3 ), methyl formate (HCOOCH3) and acetaldehyde (CH3CHO) – abundant and ubiquitous in hot molecular cores – are now being routinely detected in the gas phase towards cold (<10 K) pre-stellar cores (e.g. Bacmann et al. 2012; Jimenez-Serra et al. 2016; Scibelli & Shirley 2020). Gasphase production mechanisms for various COMs have been investigated and may contribute to some degree to their interstellar formation (e.g. Balucani et al. 2015; Taquet et al. 2016; Skouteris et al. 2019); however, recent chemical kinetics models of pre-stellar cores indicate that gas-phase mechanisms cannot reproduce observations, suggesting that grain-surface production is necessary (Scibelli et al. 2021; Tennis et al. 2021), followed by some non-thermal desorption mechanism (Harju et al. 2020; Jin & Garrod 2020).
Past astrochemical kinetic models had trouble producing COMs in any substantial abundance on cold grains due to their reliance on purely diffusive chemical reaction rates. Diffusive chemistry involving highly mobile grain-surface atomic H has long been known to drive the production of simple ice species such as H2O, NH3, CH4, H2CO, and CH3OH through the adsorption and repetitive hydrogenation of O, N, and C atoms along with CO that is formed in the gas (e.g. Hasegawa et al. 1992). But the low temperatures that are prevalent during ice formation were found to be insufficient to allow rapid diffusion by reactive species much more massive than H, such as CH3 or HCO, severely limiting their ability to be involved in reactions with other radicals and thereby produce larger molecular structures (e.g. Garrod & Herbst 2006; Enrique-Romero et al. 2022).
However, recent updates to the mechanistic treatment of grain-surface and bulk-ice chemistry used in astrochemical models of star-forming regions indicate that COMs can be formed at these very early stages, through so-called non-diffusive processes (Jin & Garrod 2020; Garrod et al. 2022). The regular grain-surface chemical reactions that lead to intermediate species, including radicals, can sometimes form their products directly adjacent to, or close to, other potential reaction partners; this would reduce or remove the need for the product of that first reaction to diffuse before meeting some other reaction partner, allowing an immediate follow-on reaction. This mechanism, called the three-body (3-B) process, was introduced into the models of Jin & Garrod (2020) and Garrod et al. (2022), based on a simpler treatment by Garrod & Pauly (2011), along with other non-diffusive reaction processes including the EleyRideal (E-R) mechanism and photodissociation-induced (PDI) reactions. The 3-B process in particular was found to be highly effective in producing COMs on grains at low temperatures, which would then survive until the desorption of the ices. This result, as related to the 3-B mechanism, aligns with recent laboratory studies showing the production of COMs on cold surfaces via the hydrogenation of CO and formaldehyde (Fedoseev et al. 2015). Also of note is the model devised by Ruaud et al. (2015) demonstrating the surface synthesis of COMs via reactions of adsorbed C atoms with major ice compounds and the formation of intermediate short-lived van der Waals complexes.
This more comprehensive modelling picture of grain-surface and ice-mantle chemistry allows the consideration of reactions that might, in the past, have been disregarded as implausible from the point of view of diffusive chemistry on cold dust grains. Garrod et al. (2022) and Lamberts et al. (2022), the latter supported by experiments, included in their chemical networks a selection of reactions in which a stable molecule on the grain could react with methylidyne (CH) or methylene (CH2). In this picture, these two species would be formed by the reaction of atomic C with mobile H or H2 ; the product CH or CH2 would in many cases be formed in the immediate vicinity of an abundant, stable molecule such as CO or H2O, allowing an immediate reaction. This is especially the case for CH, which has several reactions with stable species that involve negligible experimental activation energy barriers (see Garrod et al. 2022; Lamberts et al. 2022, and references therein). In this way, important steps in the generation of COMs would take place in tandem with the formation of the simpler, more abundant ice molecules such as CH4 and water. In a purely diffusive chemical modelling treatment, these reactions would be of negligible importance.
The expansion of the chemical networks to take advantage of this new modelling paradigm requires some care but opens up many new avenues. What reactions might plausibly precede even the formation of CH or CH2 now that the mechanistic treatments are in place?
Recent calculations (Hickson et al. 2016) and experiments (Potapov et al. 2021b) have shown that the surface reaction of carbon atoms with water ice molecules at temperatures as low as 10 K leads to the efficient formation of formaldehyde (H2CO) via the tunnelling of H. These results were corroborated by quantum chemical studies by Molpeceres et al. (2021) and Ferrero et al. (2024) that show pathways from C to formaldehyde and more complex species. Molpeceres et al. explored a number of possible pathways to the reaction of C with H2O. In particular, they find that the production of formaldehyde on an amorphous water ice surface occurs mainly through the formation of the 3C–OH2 complex, which can be converted to 3HCOH, followed by an intersystem crossing to 1HCOH and thence to 1H2CO (i.e. ground-state formaldehyde). The initial conversion to 3HCOH was found to be effective just for ‘medium’ to ‘strongly bound’ C atoms, with this process involving only modest activation energy barriers (9.7–11.5 kJ mol−1) due to the assistance of the water surface. The final-step conversion of 1HCOH → 1H2CO was found either to have low barriers or to be entirely barrierless, due to the catalysing action of highly polar water ice. With the intersystem crossing assumed to be fast, the entire process could occur efficiently, in line with the experimental evidence.
Two important points surround this C + H2O → H2CO reaction. Firstly, C and H2O are among the simplest and most abundant species available in astrophysical environments (Schilke et al. 1995; Gerin et al. 1998; Henning & Salama 1998; Whittet 2003; Tanaka et al. 2011; van Dishoeck et al. 2021). Secondly, the formation of formaldehyde opens a door to molecular complexity in space as H2CO is a potential precursor of methanol (Hiraoka et al. 1994; Pirim & Krim 2014), methyleneglycol (Duvernay et al. 2014), the sugar-like molecule glycolaldehyde (Eckhardt et al. 2018), and amino acids (Xu & Wang 2007; Danger et al. 2011; Chimiak et al. 2021).
The threshold visual extinction for the observation of solidphase water in the interstellar medium (ISM), at around 3 Mag (Whittet et al. 2001), is the lowest of the detected interstellar ices, indicating that it is the first major component of the ice to form. Moreover, observational evidence of the presence of solid-state water in the diffuse ISM was recently found (Potapov et al. 2021a). Models indicate that the early period of ice formation is dominated by the build-up of hydrides such as water and methane, along with CO2 (Garrod & Pauly 2011); CO2 has a somewhat higher threshold extinction than water. The buildup of hydrides in particular at that point is the result of the high prevalence of H and other atoms, including O and C in their neutral atomic form in the gas phase, which can be adsorbed onto the grains. It is therefore to be expected that the C + H2O → H2CO reaction would be at its most influential at those early times; the adsorption of atomic C directly from the gas phase onto the thin, water-dominated ice surface of a dust grain would be a mechanism for the early production of H2CO via the E-R process, in which the adsorbing C atom immediately meets its reaction partner, water. Past models typically indicate that formaldehyde and methanol form later on, when the conversion of CO to CO2 is less efficient, allowing some fraction of CO to be hydrogenated. The production of H2CO and CH3OH on the grains at times earlier than otherwise predicted could therefore have the effect of promoting the formation of yet more complex species, including the COMs typically observed in the gas phase in star-forming regions.
In the present study we explore the influence of the C + H2O → H2CO reaction on the outcome of astrochemical gas-grain models, with a particular focus on the formation of methanol and other COMs.
2 Methods
Two astrochemical models were run to simulate gas-phase, grainsurface and ice chemistry in a cold, collapsing core: one with and one without the addition of the C + H2O → H2CO reaction into the grain-chemistry network. The physical conditions were set up to approximate the behaviour of a cold, collapsing core in an interstellar cloud. The chemistry simulated with these models was therefore influenced by the increase in density and visual extinction, and the fall in dust temperature, as a function of time.
2.1 Chemical model
A number of gas-phase, solid-state and combined models have been developed and applied to astrochemical networks in recent years (e.g. Balucani et al. 2015; Ruaud et al. 2015; Taquet et al. 2016; Skouteris et al. 2019; Simončič et al. 2020). Our simulations used the three-phase astrochemical model MAG- ICKAL (Model for Astrophysical Gas and Ice Chemical Kinetics And Layering; Garrod 2013), which considers gas-phase chemical evolution coupled with the surface (with maximum ice thickness of 1 monolayer) and bulk-ice mantle (all ice excluding the surface layer) chemistry. The model setup employed here incorporates the chemical networks used for hot molecular core simulations by Belloche et al. (2022) and Müller et al. (2023), as well as the gas-phase ion-molecule reactions included in the network presented by Garrod & Herbst (2023). The underlying chemical model, in particular the treatment of grainsurface and ice-mantle chemistry, is identical to that presented in Garrod et al. (2022); that paper, along with Jin & Garrod (2020), provides an exhaustive description of the way in which all the main surface and ice processes are formularised, including both diffusive (Langmuir-Hinshelwood, L-H) and non-diffusive mechanisms. The latter comprise the 3-B, PDI, and E-R reaction processes. For each non-diffusive process, only the mechanics of the meeting between the reactants are different from the diffusive case; any activation-energy barrier treatments or branching ratios are treated identically in each case.
The chemical network includes 813 gas-phase species and 349 surface species, with a further 349 ice-mantle species. The gas-phase network includes ~ 13 600 gas-phase reactions and photo-processes. There are ~2600 surface reactions, which can occur through any of the diffusive or non-diffusive mechanisms, as well as photodissociation processes for each molecular species on the grains. All of the same reactions occurring in the surface layer can also take place in the ice mantles, albeit with different rates and with more limited means by which reactants may meet; following Garrod et al. (2022), bulk-ice diffusion is limited only to interstitial diffusion by H and H2 , and the E-R process is naturally limited only to surface reactions. Desorption from the surface can occur through thermal, UV-driven, or chemical desorption. For photo-desorption, the efficiencies of Öberg et al. (2009a) and Öberg et al. (2009b) are used. For chemical desorption, the formulation of Garrod et al. (2007) is used, with an efficiency a=10−3. Surface reactions are subject to the modified-rate treatment detailed by Garrod (2008) and Garrod et al. (2009).
The initial abundances used in the models are shown in Table 1. All material begins in the gas phase.
The surface and ice network includes H addition to various atoms and radicals, as well as radical-radical reactions that can produce COMs, or that can simply pass hydrogen from one radical to the other, with equal branching ratios assumed between all exothermic branches. Along with other typical grain-surface reactions, the network includes the addition of H to CO all the way to methanol (CH3OH), as well as H-abstraction from the various intermediate radicals and from H2CO and CH3OH (see Garrod 2013). Equal branching ratios are again assumed between H addition and abstraction in the reactions between H and the various radicals.
Aside from atomic carbon (see Sect. 2.2), binding energy and diffusion barriers used in the grain-surface chemistry follow previous models (Garrod et al. 2022), which includes the H diffusion barrier and binding energy calculated by Senevirathne et al. (2017). A binding energy of 4815 K is used for water (Sandford & Allamandola 1990), although at the operative temperatures in the present models, water will exhibit no appreciable thermal diffusion or desorption. The diffusion barriers for atoms are set to 0.55 times the desorption barriers, while for molecules the ratio is set to 0.35, based on a combination of computational and experimental evidence (Garrod & Pauly 2011; Karssemeijer & Cuppen 2014; Minissale et al. 2016; Garrod et al. 2022). Surface diffusion is treated as a purely thermal process, with diffusion and desorption pre-factors based on the characteristic vibrational frequency calculated as per Hasegawa et al. (1992). For atomic hydrogen, this provides a value νch = 4.09 × 10¹² s−1. As noted by Ligterink & Minissale (2023), for the calculation of desorption rates this method increasingly diverges from experimental values for larger molecules, due to the influence of the rotational partition function of the desorbing molecule (Minissale et al. 2022). Since there should be little thermal desorption of such species at the ~10 K temperatures explored here, the effect should be marginal.
Initial gas-phase atomic and molecular abundances.
2.2 Atomic carbon reactions and binding energy
The choice of binding energy of atomic carbon is naturally an important consideration in the model, as it affects both the desorption and (indirectly) the diffusion rates of that species. As part of their study of the C + H2O reaction, Molpeceres et al. (2021) calculated binding energies for C on water clusters (of 14 H2O molecules) ranging from 60–133 kJ mol−1 (~7200–16 000 K). We adopted their average binding energy value of 96 kJ mol−1 (11550 K).
Shimonishi et al. (2018) and Duflot et al. (2021) calculated average values for C binding of 14 100±420 K and 9460±1530 K, respectively. In their experimental work on C-atom deposition onto amorphous water ice, Tsuge et al. (2023) suggest that 60–90% of the carbon atoms are chemisorbed, while up to 30% are physisorbed and up to 30% react with H2O to form H2CO (see also Sect. 2.3). Of those C atoms adsorbed into weak binding sites (2550–5100 K), surface diffusion becomes active at temperatures greater than ∼22 K. Thus, neither the diffusion nor desorption of C atoms should be important at the temperatures of interest. Our chosen C-atom binding energy ensures that neither process is significant in our models.
Notably for the purposes of the present work, atomic hydrogen can react with carbon atoms sequentially to form methane (CH4). CH2 and CH3 can also be further hydrogenated via the barrier-mediated abstraction of hydrogen from H2 , to form CH3 and CH4, respectively (e.g. Lamberts et al. 2022).
The grain-surface network includes the reaction of H2 with atomic C to produce CH2. Simončič et al. (2020) proposed the inclusion of this reaction without an activation energy barrier, based on experimental work by Krasnokutski et al. (2016) and Henning & Krasnokutski (2019) using helium droplets; it was included without a barrier in the Garrod et al. (2022) models. The reaction was recently studied both experimentally and computationally by Lamberts et al. (2022). These authors conducted experiments involving the co-deposition of combinations of water, atomic carbon, H, H2, D and D2 onto a surface at 10 K, determining reaction products via reflection-absorption infrared spectroscopy. They also calculated potential energy surfaces and activation energy barriers for the C + H2 reaction, based on binding of C to either one or three water molecules using various levels of theory. Their experimental results suggest that methane can be formed even in laboratory setups in which H2 is codeposited with C and H2O, without the presence of atomic H, thus indicating that the C + H2 reaction is fairly efficient. Their computational results indicated, however, that the reaction does nevertheless have an activation energy barrier, and that it tends to increase with the number of water molecules in the cluster. Their calculated barrier for the reaction of H2 with a C atom bound to three water molecules (using the B3LYP level of theory) was 77.9 kJ mol−1 (9370 K).
Given that the reaction proceeds effectively at 10 K regardless of how large its activation energy barrier is, we assumed a tunnelling mechanism to be operative when including it in our present models. Unfortunately, the Lamberts et al. (2022) calculations do not include an explicit evaluation of the reaction rate that we could otherwise adopt. In our model, and without other information, grain-surface tunnelling reaction rates are calculated based on a simple rectangular barrier treatment, requiring a barrier height and width as input. To determine an appropriate value for the unknown barrier-width parameter (while adopting EA = 9370 K), we set up the MAGICKAL model to use the experimental deposition rates for H2 O, C and H2 , along with other parameters, used by Lamberts et al. (2022) in their experiment 3B. We note that D2 is not included in our model setup, as our network does not include deuterium, but the deuteration of methane is not expected to be important to CH4 production. All processes and species unrelated to the experimental conditions are switched off. Treating the C + H2 → CH2 barrier width as a free parameter, we find that the methane production begins to fall off substantially for barriers wider than 0.4 Å. We thus adopted this value in the models, in combination with the stated activation energy barrier. Lamberts et al. (2022) do not indicate explicit production rates or abundances for their experiments, so a more direct comparison with the experimental results is not possible.
2.3 Inclusion of the C + H2O → H2CO reaction
To the existing chemical model we added the new C + H2O → H2CO reaction using an activation energy barrier of 11.5 kJ mol−1 (1380 K), based on the calculated value of Molpeceres et al. (2021). This corresponds to the initial conversion of 3C–OH2 to3 HCOH for a C atom that is bound under ‘medium’ strength conditions, consistent with our adoption of the average C-atom binding energy calculated by the same authors (see Sect. 2.2). This constitutes the larger of the two calculated activation barriers for this step in the sequence. The final step (1 HCOH → 1H2CO) can also have a barrier of up to 12 kJ mol−1 or be barrier-less, depending on the binding site. However, even with a non-zero barrier, in the absence of competition from other reactive processes, this step should be expected to proceed rapidly. On this basis, we assumed that all the subsequent steps are rapid in comparison with the first barrier-mediated step, allowing the entire process to be incorporated into a single reaction.
At the temperatures tested here (<15 K), the reaction is assumed to proceed by the tunnelling of H through a 1 Å rectangular barrier (Hasegawa et al. 1992), in lieu of a more accurate estimate. We note that the adopted activation energy barrier for the grain-surface reaction is lower than the gas-phase value of 4180 K determined by Li et al. (2017).
Due to the presence of a barrier, competition between the reaction and various other processes must be considered once the reactants have met on the grain surface. It has now become typical in gas-grain astrochemical models to take account of the competition between a barrier-mediated reaction and the diffusion of one or other reactant out of the binding site (e.g. Chang et al. 2007; Garrod & Pauly 2011). For reactants with large barriers against diffusion, multiple reaction attempts can be made before one species diffuses away from the other, allowing even reactions with substantial activation energy barriers to be efficient once the reactants are brought together (whether by diffusive or non-diffusive means). The very large binding energies, and thus diffusion barriers, for both atomic C and water adopted in this model mean that thermal diffusion is very slow compared with the rate of tunnelling through the activation energy barrier at the temperatures of interest here.
However, as noted by Jin & Garrod (2020) and Garrod et al. (2022), other processes can also disrupt a barrier-mediated reaction; in the model used here, the competition calculations for all such reactions include the rate at which one or the other reactant can be photo-dissociated, and the rate at which atomic hydrogen can diffuse into the same binding site, allowing an alternative reaction to take place instead (e.g. C + H → CH). The overall reaction probability per meeting event (whether diffusive or non- diffusive) for the C + H2O → H2CO reaction is therefore given by Eq. (1):
 (1)
(1)
where ktunn is the rate at which the reaction proceeds via tunnelling, khop(i) represents the rate of a single hop (away from the reaction partner) by species i, kPD (H2O) is the photodissociation rate of the water molecule, and kdiff (H)N(H) is the rate at which surface hydrogen arrives at the binding site, where N(H) is the population of H-atoms on the entire grain surface at that moment. We note that kdiff(i) depends on the number of surface binding sites, NS (i.e. kdiff(i) ≃ khop(i)/NS), and can also be affected by back-diffusion; our model uses the formulation of Willis & Garrod (2017) to account for this effect. Like atomic H, H2 could in principle diffuse towards and react with atomic C to interfere with the reaction with water; however, the presence of an activation energy barrier for the C + H2 → CH2 reaction makes it insufficiently competitive for consideration in Eq. (1).
With the inclusion of these various competition terms, we therefore ensure that the probability of the C + H2O → H2CO reaction (and the other barrier-mediated reactions) is treated appropriately for the local physical and chemical conditions throughout the model run. The full version of this equation as used in the models also includes the desorption rates kdes(i), but these are negligible in this case. As already noted, even the diffusion rates are too slow to affect fact meaningfully.
Furthermore, based on surface H abundance values taken from the models presented in Sect. 3, which reach a maximum of N(H)≃0.6 early in the model runs, the kdiff(H)N(H) term never exceeds ~2 × 10⁻⁷ktunn· Thus, the arrival of atomic H is never competitive with the C + H2O reaction.
Under low-AV conditions, photodissociation of H2O can be somewhat competitive with certain barrier-mediated reactions of other species. However, again, even at the initial extinction of 3 mag at which the UV field in this chemical model is strongest, the calculated photodissociation rate is negligible compared with the reaction tunnelling rate.
Thus, even with multiple possible competing processes, the C + H2O → H2CO is always highly efficient in the model presented here. As such, despite the technical presence of a barrier in the model, there is no effective difference between this model and one in which the barrier is set at zero.
The C + H2O → H2CO reaction is also included in the bulkice chemistry network. There, it occurs through either the 3-B or the PDI process, using a similar competition term.
2.4 Physical model
The time-dependent physical model is based on a 0-D, isothermal free-fall collapse, as used in past models of hot-core chemical evolution (e.g. Brown et al. 1988; Garrod et al. 2006, 2022). The initial physical conditions are representative of a translucent cloud: nH,init = 3000 cm−3, AV = 3, Tgas = 10 K. Over a period of ~ 1 Myr, density and visual extinction grow, with the physical and chemical evolution being halted at gas density 2 × 108 cm−3. The visual extinction scales over time as AV = AV,init(nH/nH,init)2/3, while the gas temperature is held steady. The dust temperature is determined using the visual extinction-dependent formula of Garrod & Pauly (2011), beginning at ~14.7 K and falling to 8 K. Gas density and dust temperature throughout the evolution are plotted in Fig. 1. Most of the change in these quantities occurs after ~ 105 yr.
Because the availability of free carbon atoms – and thus the importance of the new reaction – is greatest during the collapse stage, we did not simulate the subsequent warm-up phase of hot cores.
3 Results
3.1 Major ice components
Figure 2 shows simulated layer-by-layer dust-grain ice compositions from the two models, as determined at the moment that each ice layer is deposited (at times indicated on the top axis).
Results are shown for the most abundant molecules, for a model without the C + H2O → H2CO reaction (panel a), and for a model with the new reaction included using an activation energy barrier of height 1380 K (panel b).
Although bulk-ice chemistry is included in the model, the abundances of the major ice constituent species plotted in Fig. 2 are not substantially altered by chemistry occurring once those species have been incorporated into the bulk-ice mantle beneath the surface layer. The chemistry producing these species occurs predominantly on the grain or ice surface, except for CO, which also has strong gas-phase production prior to adsorption onto the grain.
In both panels, water is clearly the dominant ice component throughout most of the simulated time, with CO only taking over at late times as the gas-phase oxygen budget falls off and CO freeze-out increases. At early times, CO2 is seen to be the second most abundant ice species, although CO takes over later (at around 50 ML ice thickness); thereafter, CO and CO2 maintain a fairly stable ratio.
As described in detail by Garrod & Pauly (2011), this switchover in dominance between CO2 and CO is caused by the falling dust temperature associated with increasing visual extinction. Above ~12 K, CO is sufficiently mobile on the surface to be able to compete with the mobile, but volatile, H2 to reach and react with OH radicals on the surface to produce CO2 via the reaction CO + OH → CO2 + H, which has a very modest barrier in these models. If H2 meets an OH radical first, it is able to produce water via the barrier-mediated reaction H2 + OH → H2O + H. Below the ~12 K threshold temperature, CO is not competitive in its diffusion to meet OH; CO2 formation instead occurs when H reacts with atomic O in the presence of CO, such that the product radical OH and the nearby CO are immediately in contact and can react without further diffusion. Because this 3-B process is dependent on the surface coverage of CO, and not on its diffusion rate, the CO2:CO ratio remains stable when this mechanism is operative.
The differences between the two panels are evident only in the first ~100 ML of ice; beyond this point, the fractional compositions of the main ice components are essentially identical. In the deepest (i.e. earliest) layers, there is a notable difference in CO2 abundance. With the new reaction switched on, CO2 is more prevalent in the first ~50 ML, reaching a more consistently elevated abundance especially in the 20–50 ML depth range. This effect is related to enhanced CO2 production, which also drives a somewhat lower water abundance in those deepest ice layers in panel b.
The cause of this behaviour is, naturally, the new C + H2O → H2CO reaction. Once the first few monolayers of ice have formed on the grain surface, atomic carbon from the gas phase is adsorbed onto an ice surface composed of >50% water, leading to efficient E-R production of H2CO. For carbon atoms that do not land directly on a water molecule, their reaction with mobile H2 rapidly leads to the production of CH2.
The difference in the abundance of formaldehyde itself between panels a and b is not so evident from the figure; in fact, although there is an enhancement in H2CO abundance in the deeper ice layers, much of this is passed on to methanol or to CO, via addition of atomic H or abstraction of H by other H atoms correspondingly. Notably, although the CO abundance rises as a result, the CO in turn is converted into CO2, due to the high efficiency of this process as described above. Therefore, much of the overall loss in water abundance and production of formaldehyde ultimately manifests in increased CO2 in those deepest ice layers. The lower water abundance in the deepest layers is thus caused by the new reaction destroying H2O directly, but also by the related production of CO from the additional H2CO, which competes to react with OH. It should be noted also that the number of monolayers of ice produced in the model, which is based on a simple molecule count, is somewhat lower in the model with the new reaction included, due to the incorporation of more oxygen into CO2 instead of forming water.
As seen in Fig. 2, there is an unsurprising reduction in CH4 production in the deeper ice layers with the new reaction included, caused by the reaction of C atoms with water before they can be hydrogenated. But in the upper layers (>100 ML), despite water still being the dominant ice species, the production of CH4 appears unaffected by the new reaction. In fact, the C + H2O → H2CO reaction is still occurring on the surface, with around 50% of adsorbed carbon being converted to formaldehyde, and a similar quantity being converted to CH2 and thence to CH4 . However, at this point the hydrogenation of carbon on the grains is no longer the dominant source of surface methane; instead, the adsorption of gas-phase methane takes over, as much of the remaining gas-phase carbon budget becomes incorporated into methane and other hydrocarbons (the well-known early-time hydrocarbon peak). This drop-off in gas-phase atomic carbon abundance is the ultimate cause of the similarity of layer-by-layer ice abundances between models with and without the new reaction, at ice thicknesses of >100 ML, which occurs at ~7–8 × 10⁵ yr.
Table 2 shows the abundances of the main ice constituents at the end of the two model runs, provided as percentages of the total ice composition. Keeping in mind that the total amount of ice is slightly lower in the model with the new reaction, due to slightly less water being present, the changes in abundances for these simple species are overall fairly small. There is a more significant overall drop in methane abundance, and small but significant increases in CO2 and methanol.
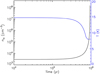 |
Fig. 1 Gas density and dust temperature in the model as a function of time. |
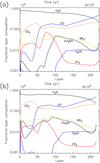 |
Fig. 2 Fractional compositions of the main components of the ice as a function of the ice layer, in the regular model (panel a) and in the model including the C + H2O reaction (panel b). Each layer composition is determined at the moment of incorporation into the bulk ice, indicated by the top axis. The deepest ice layers are on the left, and layers closest to the ice surface are on the right. |
Final simulated abundances of major ice constituents as a percentage of total ice.
3.2 Complex organic molecules
The difference in methanol ice abundance in the first 100 ML is substantial; without the new reaction, this molecule represents less than 1% of the ice content in the first 80 ML. The inclusion of the reaction in the network results in a methanol fraction as high as ~3.5% in the first few monolayers, falling to around 0.5% while CO2 production is strong, then rising to a few percent at around the 50 ML mark. The enhancements are caused by the greater production of CO resulting from H-abstraction from H2CO as described above.
This increased production of methanol on the grain surface is accompanied by a substantial rise in its gas-phase abundance. Figure 3 shows abundances with respect to total hydrogen, nH , as a function of linear time, for a selection of species both in the gas phase (solid lines) and on the grains (dotted lines). Panels a and c show abundances from the model without the new reaction; panels b and d show results from the model with the reaction included.
The increase in methanol abundance in the gas phase is caused by more rapid chemical desorption from the grains, which is the direct result of the increased surface methanol production. Interestingly, methanol fractional abundance now remains quite steady at a little under 10−9 through most of the model run, although it still reaches its peak at ~8 × 10⁵ yr, before falling away as the collapse reaches its conclusion. This suggests that the presence of the new reaction in the network allows gas-phase methanol abundance to remain quite high – consistent with typical dark-cloud observations (e.g. Tafalla et al. 2006; Bizzocchi et al. 2014; Potapov et al. 2016) – both at the early times when CO abundance on the grains is nominally small and when it builds up strongly at later times.
It is notable that gas-phase formaldehyde abundance does not vary significantly with the inclusion of the new reaction. Unlike methanol, formaldehyde has effective gas-phase production routes that make its grain-surface formation and chemical desorption far less important to the gas-phase abundance.
Some of the larger COMs shown in Fig. 3 are also moderately enhanced during the early period (<7 × 10⁵ yr) when the new reaction has a strong effect on the grain-surface chemistry. These include acetaldehyde (CH3CHO), formic acid (HCOOH), ethanol (C2H5OH), and the structural isomers methyl formate (HCOOCH3) and acetic acid (CH3COOH). The abundances of most of these species rise at early times, but not to values greater than their peak values, which typically occur in the later period. Each of these species benefit from the increased formaldehyde and methanol production, which necessarily involves the production of intermediate radicals such as HCO and CH3O that are involved in non-diffusive surface reactions that produce COMs. When the COMs are formed on the grain-surfaces, some fraction of them are released into the gas phase as with methanol. For acetaldehyde there is a modest decline in its later-time gasphase peak value in the model with the new reaction included (see Table 3).
In the case of dimethyl ether (DME, CH3OCH3), its earlytime gas-phase abundance, which is already quite high, of the order of a few times 10−10, falls very slightly with the introduction of the new reaction. This is caused by the drop in CH2 production; the chemical network includes a reaction between methylene, CH2 , and methanol that can produce DME (see Garrod et al. 2022). The decrease in DME production is related to the lower production of CH2 , but it lasts only while the methanol abundance is also depressed, when grain-surface CO2 production is at its early peak. Once methanol production picks up (~35 ML), the reaction is again productive, forming even more DME in the model with the C + H2O reaction included. Notably, as a result of this increased production, the moment of peak gas-phase abundance of DME shifts to later times.
Table 4 indicates the abundances of selected ice species at the end of the two models (expressed as a fraction of total hydrogen). These values are of interest as they indicate the amount of COM material that would be inherited by the later hot-core stage, should the cold core simulated here continue its evolution towards forming a protostar. Although there are increases by as much as a factor of 3 for ketene (CH2CO) and acetaldehyde, and a rise in the abundance of DME by a factor of around 2, the effect the new C + H2O reaction on the ultimate ice abundances of most oxygen-bearing COMs is fairly modest.
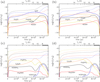 |
Fig. 3 Fractional abundances of selected molecules with respect to total hydrogen as a function of linear time, in the regular model (panels a and c) and in the model including the C + H2O reaction (panels b and d). The top axis indicates the dust temperature evolution, which takes a minimum value of 8 K. The solid lines indicate gas-phase abundances, and dotted lines of the same colour indicate the same species on the dust grains, in the same units. |
Peak gas-phase fractional abundances of selected organic molecules with respect to total hydrogen. A(-B) indicates A × 10−B.
4 Discussion
This study provides one more piece of evidence of the sensitivity of astrochemical networks to additions of new reactions. Particularly important are reactions involving simple species, as they stand at the beginning of the networks and can define their further evolution. We demonstrate that the addition of the C + H2O → H2CO surface reaction influences the abundances of simple molecules, such as CO, CO2, CH4, and CH2CO, as well as COMs, such as CH3OH, CH3OCH3, and CH3CHO, in both gas phase and solid state. Filling in the gaps in the chemical networks, such as barrierless reactions of atomic carbon with stable grain-surface species, brings us a step closer to having comprehensive gas-grain networks that can correctly reproduce and predict interstellar ice abundances, allowing us to determine new targets for astronomical observations and explain the results of laboratory experiments.
Regarding new abundances obtained in the present study for simple molecules, the strongest effect is observed for CO2 . Stronger production of CO2 early on in the models indicates a larger amount of what can be identified as polar CO2 being formed in the presence of water (see Garrod & Pauly 2011). So although the overall increase is modest, the increase in polar CO2 is perhaps more substantial. The first 50 ML may be even richer in CO2 than previous models suggest, all else being equal. Although the amounts of CO in those ices is small, CO2 gains at the expense of water, so that the CO2:H2O ratio could be close to unity in the early ices.
Surprisingly, the solid-state abundance of H2CO is barely affected by the new reaction that directly produces H2CO. However, this result is clearly explained by the high reactivity of H2CO with hydrogen atoms, leading to the conversion of formaldehyde into methanol and CO, the latter of which is then converted to CO2 . Efficient conversion of H2CO into CO2 and CH3OH was also demonstrated by laboratory experiments on the UV irradiation of H2CO (Potapov et al. 2021b).
The recent quantum chemical study by Molpeceres et al. (2021) demonstrated that the reaction of C with H2O on an amorphous water ice surface leads to the formation of the 3C–OH2 complex; after overcoming a modest activation energy barrier, this is converted to 3HCOH, followed by an intersystem crossing to 1HCOH, and finally to ground-state formaldehyde. In our chemical kinetic treatment, no intermediates are considered, and C + H2O directly forms H2CO. The activation barrier of 11.5 kJ/mol for the first step is found in our models to lead to rapid enough production of formaldehyde that no competing processes have any substantial effect on the conversion rate. Thus, from the point of view of formaldehyde production in particular, the inclusion of explicit intermediate species in the network is likely unnecessary to obtain an accurate result.
Ferrero et al. (2024) recently studied the reactivity of the 3C–OH2 complex, finding that it efficiently reacts with radical ice species as a competitive process to the formation of stable H2CO. Since we find in our kinetics models that the reaction of C with water to produce formaldehyde is more rapid even than the arrival of atomic H on the grain surfaces, it is unlikely that diffusive processes would lead to the reaction of the C-H2O intermediate. Rather, any reaction between that species and a surface radical would require that radical be in close proximity at the time of C-H2O formation (via the E-R mechanism). It is unclear how competitive the production of the C-H2O intermediate might be in the presence of a pre-existing radical, or whether the carbon atom might react directly with the radical itself. Nevertheless, such reactions could plausibly act to enhance the degree of chemical complexity on the grains.
Regarding new abundances obtained in the present study for COMs, the strongest effect (an increased abundance) is observed for methanol. The presence of the new reaction in the network allows the abundance of gas-phase methanol to remain quite high – consistent with typical dark-cloud observations. We note, however, that the gas-phase abundances of COMs at low temperatures are, in our models, driven by chemical desorption, for which the efficiency is poorly defined at present. Methanol is generally taken to be a starting point towards the formation of more COMs in interstellar molecular clouds both in the gas phase and in the solid state (Öberg et al. 2009c; Vasyunin & Herbst 2013; Balucani et al. 2015). Further reactions involving formaldehyde, methanol, and their radicals explain the increased and/or altered abundances of, for example, acetaldehyde, ethanol, methyl formate, and dimethyl ether. All these COMs have been detected in the ISM (see McGuire 2022, and references therein).
In their computational study, Molpeceres et al. (2021) noted that not all meetings of C and H2O would lead to reaction; the experimental work of Tsuge et al. (2023) indicated a similar result, suggesting up to 30% of C atoms would react to form H2CO. Although our model does not incorporate an efficiency of less than unity for this reaction, the expected effect would simply be a production rate lowered by this factor. Hence, the production of complex organics would likely be reduced by a similar factor. A somewhat higher conversion of atomic C into methane might also be expected, for those atoms that do not react with water.
We note that the increases in the gas-phase abundances of the COMs (methanol most notably) at early times in the models are, in general, unlikely to affect the further observability of these molecules, particularly, in cold regions, as the peak abundances are not strongly affected. However, an interesting point is that higher abundances of COMs such as dimethyl ether and ethanol are observed in early times (1–6 × 10⁻⁵ years) as compared to the later times. This result may guide observers looking for appropriate targets for COM detection to choose relatively ‘young’ pre-stellar cores.
The increased abundances of certain COMs, especially in the solid phase, is evidence that their formation is more efficient than previously assumed. One of the open questions is the level of molecular complexity in astrophysical environments. Higher abundances of COMs, many of which are considered as precursors of prebiotic species essential to the chemistry of life on Earth, should stimulate further observational searches leading us to a better understanding of the pathways to life on Earth and, potentially, on extrasolar planets.
Since the submission of this manuscript, new experimental work by Tsuge et al. (2024) has been published. The authors concluded that atomic C deposited onto a cold (10 K), amorphous water-ice surface is initially physisorbed on the surface; of this, around 30% is able to react rapidly with water to form formaldehyde. The remainder does not react with the water, but ~40% becomes chemisorbed while the other 30% remains physisorbed. In this picture, the chemisorbed C-atoms are no longer chemically active (within the detection limits of the experiments), while some fraction of the remaining physisorbed carbon is able to react with H and/or H2 , thence going on to form methane. However, the production of CH4 on the ice surface does not seem to have a strong effect on the efficiency of the C + H2O → H2CO reaction (the prime focus of our own modelling efforts), which occurs rapidly upon deposition of carbon.
The development of a detailed chemical model considering separate physisorbed and chemisorbed atom populations is a challenging task. No such model currently exists, and it is unclear how accurate such a rate equation-based treatment can be (see e.g. Cuppen & Garrod 2011). This presents a door to possible future study.
5 Conclusions
The results of astrochemical modelling using a network with and without the C + H2O reaction are presented. The effects of the new reaction are important only in the deeper ice layers (<100 ML) due to the later fall in gas-phase atomic carbon abundances. The addition of the reaction influences the abundances of both simple and complex species in the solid state as well as modestly in the gas phase. The CO2 ice abundance is increased at early times, coming close to water abundance levels in those thin early ices, indicating a stronger polar CO2 ice component in the ISM. Enhanced abundances of COMs, such as methanol, acetaldehyde, methyl formate, ethanol, and dimethyl ether, provide evidence that their formation is more efficient than previously believed. The presence of the new reaction in the network allows gas-phase methanol abundances to remain quite high even at early times, at levels consistent with typical darkcloud observations. The early-time gas-phase COM abundances are generally increased but are likely not at levels that would affect their observability in dense cores and clouds. However, a more efficient formation of COMs as a result of the inclusion of the new reaction demonstrates that the level of molecular complexity in astrophysical environments can be higher than we expect and should motivate further investigations.
Acknowledgements
A.P. acknowledges support from the Deutsche Forschungs- gemeinschaft (Heisenberg grant PO 1542/7-1). R.T.G. thanks the Astronomy & Astrophysics program of the National Science Foundation (award No. 2206516) for supporting the chemical modelling presented here. We thank the anonymous referee for helpful comments and suggestions.
References
- Altwegg, K., Balsiger, H., Bar-Nun, A., et al. 2016, Sci. Adv., 2, e1600285 [NASA ADS] [CrossRef] [Google Scholar]
- Arumainayagam, C. R., Garrod, R. T., Boyer, M. C., et al. 2019, Chem. Soc. Rev., 48, 2293 [Google Scholar]
- Bacmann, A., Taquet, V., Faure, A., Kahane, C., & Ceccarelli, C. 2012, A&A, 541, L12 [NASA ADS] [CrossRef] [EDP Sciences] [Google Scholar]
- Balucani, N., Ceccarelli, C., & Taquet, V. 2015, MNRAS, 449, L16 [Google Scholar]
- Belloche, A., Garrod, R. T., Zingsheim, O., Müller, H. S. P., & Menten, K. M. 2022, A&A, 662, A110 [NASA ADS] [CrossRef] [EDP Sciences] [Google Scholar]
- Bizzocchi, L., Caselli, P., Spezzano, S., & Leonardo, E. 2014, A&A, 569, A27 [NASA ADS] [CrossRef] [EDP Sciences] [Google Scholar]
- Brown, P. D., Charnley, S. B., & Millar, T. J. 1988, MNRAS, 231, 409 [Google Scholar]
- Chang, Q., Cuppen, H. M., & Herbst, E. 2007, A&A, 469, 973 [NASA ADS] [CrossRef] [EDP Sciences] [Google Scholar]
- Chimiak, L., Elsila, J. E., Dallas, B., et al. 2021, Geochim. Cosmochim. Acta, 292, 188 [NASA ADS] [CrossRef] [Google Scholar]
- Cobb, A. K., & Pudritz, R. E. 2014, ApJ, 783, 140 [NASA ADS] [CrossRef] [Google Scholar]
- Cronin, J., & Chang, S. 1993, in Chemistry of Life’s Origins, eds. J. M. Greenberg, V. Pirronello, & C. Mendoza-Gomez, (Dordrecht: Springer), 209 [CrossRef] [Google Scholar]
- Cuppen, H. M., & Garrod, R. T. 2011, A&A, 529, A151 [NASA ADS] [CrossRef] [EDP Sciences] [Google Scholar]
- Danger, G., Borget, F., Chomat, M., et al. 2011, A&A, 535, A47 [NASA ADS] [CrossRef] [EDP Sciences] [Google Scholar]
- Duflot, D., Toubin, C., & Monnerville, M. 2021, Front. Astron. Space Sci., 8, 24 [NASA ADS] [CrossRef] [Google Scholar]
- Duvernay, F., Danger, G., Theule, P., Chiavassa, T., & Rimola, A. 2014, ApJ, 791, 75 [NASA ADS] [CrossRef] [Google Scholar]
- Eckhardt, A. K., Linden, M. M., Wende, R. C., Bernhardt, B., & Schreiner, P. R. 2018, Nat. Chem., 10, 1141 [Google Scholar]
- Elsila, J. E., Glavin, D. P., & Dworkin, J. P. 2009, Meteorit. Planet. Sci., 44, 1323 [NASA ADS] [CrossRef] [Google Scholar]
- Enrique-Romero, J., Rimola, A., Ceccarelli, C., et al. 2022, ApJS, 259, 39 [NASA ADS] [CrossRef] [Google Scholar]
- Fedoseev, G., Cuppen, H. M., Ioppolo, S., Lamberts, T., & Linnartz, H. 2015, MNRAS, 448, 1288 [NASA ADS] [CrossRef] [Google Scholar]
- Ferrero, S., Ceccarelli, C., Ugliengo, P., Sodupe, M., & Rimola, A. 2024, ApJ, 960, 22 [NASA ADS] [CrossRef] [Google Scholar]
- Garrod, R. T. 2008, A&A, 491, 239 [NASA ADS] [CrossRef] [EDP Sciences] [Google Scholar]
- Garrod, R. T. 2013, ApJ, 765, 60 [Google Scholar]
- Garrod, R. T., & Herbst, E. 2006, A&A, 457, 927 [NASA ADS] [CrossRef] [EDP Sciences] [Google Scholar]
- Garrod, R. T., & Herbst, E. 2023, Faraday Discuss., 245, 541 [NASA ADS] [CrossRef] [Google Scholar]
- Garrod, R. T., & Pauly, T. 2011, ApJ, 735, 15 [Google Scholar]
- Garrod, R., Park, I. H., Caselli, P., & Herbst, E. 2006, Faraday Discuss., 133, 51 [Google Scholar]
- Garrod, R. T., Wakelam, V., & Herbst, E. 2007, A&A, 467, 1103 [NASA ADS] [CrossRef] [EDP Sciences] [Google Scholar]
- Garrod, R. T., Vasyunin, A. I., Semenov, D. A., Wiebe, D. S., & Henning, T. 2009, ApJ, 700, L43 [NASA ADS] [CrossRef] [Google Scholar]
- Garrod, R. T., Jin, M., Matis, K. A., et al. 2022, ApJS, 259, 1 [NASA ADS] [CrossRef] [Google Scholar]
- Gerin, M., Phillips, T. G., Keene, J., Betz, A. L., & Boreiko, R. T. 1998, ApJ, 500, 329 [NASA ADS] [CrossRef] [Google Scholar]
- Harju, J., Pineda, J. E., Vasyunin, A. I., et al. 2020, ApJ, 895, 101 [NASA ADS] [CrossRef] [Google Scholar]
- Hasegawa, T. I., Herbst, E., & Leung, C. M. 1992, ApJS, 82, 167 [Google Scholar]
- Henning, T. K., & Krasnokutski, S. A. 2019, Nat. Astron., 3, 5684 [Google Scholar]
- Henning, T., & Salama, F. 1998, Science, 282, 2204 [NASA ADS] [CrossRef] [Google Scholar]
- Hickson, K., Loison, J., Nuñez-Reyes, D., & Mereau, R. 2016, J. Phys. Chem. Lett., 7, 3641 [Google Scholar]
- Hiraoka, K., Ohashi, N., Kihara, Y., et al. 1994, Chem. Phys. Lett., 229, 408 [Google Scholar]
- Jimenez-Serra, I., Vasyunin, A. I., Caselli, P., et al. 2016, ApJ, 830, L6 [CrossRef] [Google Scholar]
- Jin, M. W., & Garrod, R. T. 2020, ApJS, 249, 26 [NASA ADS] [CrossRef] [Google Scholar]
- Jorgensen, J. K., Belloche, A., & Garrod, R. T. 2020, ARA&A, 58, 727 [CrossRef] [Google Scholar]
- Karssemeijer, L. J., & Cuppen, H. M. 2014, A&A, 569, A107 [NASA ADS] [CrossRef] [EDP Sciences] [Google Scholar]
- Krasnokutski, S. A., Kuhn, M., Renzler, M., et al. 2016, ApJ, 818, L31 [CrossRef] [Google Scholar]
- Lamberts, T., Fedoseev, G., van Hemert, M. C., et al. 2022, ApJ, 928, 48 [NASA ADS] [CrossRef] [Google Scholar]
- Li, J., Xie, C. J., & Guo, H. 2017, Phys. Chem. Chem. Phys., 19, 23280 [Google Scholar]
- Ligterink, N. F. W., & Minissale, M. 2023, A&A, 676, A80 [NASA ADS] [CrossRef] [EDP Sciences] [Google Scholar]
- McGuire, B. A. 2022, ApJS, 259, 30 [NASA ADS] [CrossRef] [Google Scholar]
- Minissale, M., Congiu, E., & Dulieu, F. 2016, A&A, 585, A146 [NASA ADS] [CrossRef] [EDP Sciences] [Google Scholar]
- Minissale, M., Aikawa, Y., Bergin, E., et al. 2022, ACS Earth Space Chem., 6, 597 [NASA ADS] [CrossRef] [Google Scholar]
- Molpeceres, G., Kastner, J., Fedoseev, G., et al. 2021, J. Phys. Chem. Lett., 12, 10854 [CrossRef] [Google Scholar]
- Müller, H. S. P., Garrod, R. T., Belloche, A., et al. 2023, MNRAS, 523, 2887 [CrossRef] [Google Scholar]
- Öberg, K. I., & Bergin, E. A. 2021, Phys. Rep., 893, 1 [Google Scholar]
- Öberg, K. I., Linnartz, H., Visser, R., & van Dishoeck, E. F. 2009a, ApJ, 693, 1209 [Google Scholar]
- Öberg, K. I., van Dishoeck, E. F., & Linnartz, H. 2009b, A&A, 496, 281 [NASA ADS] [CrossRef] [EDP Sciences] [Google Scholar]
- Öberg, K. I., Garrod, R. T., van Dishoeck, E. F., & Linnartz, H. 2009c, A&A, 504, 891 [NASA ADS] [CrossRef] [EDP Sciences] [Google Scholar]
- Pirim, C., & Krim, L. 2014, RSC Adv., 4, 15419 [Google Scholar]
- Potapov, A., & McCoustra, M. R. S. 2021, Int. Rev. Phys. Chem., 40, 299 [CrossRef] [Google Scholar]
- Potapov, A., Sanchez-Monge, A., Schilke, P., et al. 2016, A&A, 594, A117 [NASA ADS] [CrossRef] [EDP Sciences] [Google Scholar]
- Potapov, A., Bouwman, J., Jäger, C., & Henning, T. 2021a, Nat. Astron., 5, 78 [NASA ADS] [CrossRef] [Google Scholar]
- Potapov, A., Krasnokutski, S. A., Jager, C., & Henning, T. 2021b, ApJ, 920, 111 [CrossRef] [Google Scholar]
- Ruaud, M., Loison, J. C., Hickson, K. M., et al. 2015, MNRAS, 447, 4004 [Google Scholar]
- Sandford, S. A., & Allamandola, L. J. 1990, ApJ, 355, 357 [NASA ADS] [CrossRef] [Google Scholar]
- Sandford, S. A., Nuevo, M., Bera, P. P., & Lee, T. J. 2020, Chem. Rev., 120, 4616 [NASA ADS] [CrossRef] [Google Scholar]
- Schilke, P., Keene, J., Lebourlot, J., Desforets, G. P., & Roueff, E. 1995, A&A, 294, L17 [NASA ADS] [Google Scholar]
- Scibelli, S., & Shirley, Y. 2020, ApJ, 891, 73 [NASA ADS] [CrossRef] [Google Scholar]
- Scibelli, S., Shirley, Y., Vasyunin, A., & Launhardt, R. 2021, MNRAS, 504, 5754 [NASA ADS] [CrossRef] [Google Scholar]
- Senevirathne, B., Andersson, S., Dulieu, F., & Nyman, G. 2017, Mol. Astrophys., 6, 59 [CrossRef] [Google Scholar]
- Shimonishi, T., Nakatani, N., Furuya, K., & Hama, T. 2018, ApJ, 855, 27 [Google Scholar]
- Simoncic, M., Semenov, D., Krasnokutski, S., Henning, T., & Jäger, C. 2020, A&A, 637, A72 [NASA ADS] [CrossRef] [EDP Sciences] [Google Scholar]
- Skouteris, D., Balucani, N., Ceccarelli, C., et al. 2019, MNRAS, 482, 3567 [CrossRef] [Google Scholar]
- Tafalla, M., Santiago-Garcia, J., Myers, P. C., et al. 2006, A&A, 455, 577 [NASA ADS] [CrossRef] [EDP Sciences] [Google Scholar]
- Tanaka, K., Oka, T., Matsumura, S., Nagai, M., & Kamegai, K. 2011, ApJ, 743, L39 [NASA ADS] [CrossRef] [Google Scholar]
- Taquet, V., Wirstrom, E. S., & Charnley, S. B. 2016, ApJ, 821, 46 [NASA ADS] [CrossRef] [Google Scholar]
- Tennis, J., Loison, J. C., & Herbst, E. 2021, ApJ, 922, 133 [NASA ADS] [CrossRef] [Google Scholar]
- Tsuge, M., Molpeceres, G., Aikawa, Y., & Watanabe, N. 2023, Nat. Astron., 7, 1351 [NASA ADS] [CrossRef] [Google Scholar]
- Tsuge, M., Molpeceres, G., Aikawa, Y., & Watanabe, N. 2024, ApJ, 973, 80 [NASA ADS] [CrossRef] [Google Scholar]
- van Dishoeck, E. F., Kristensen, L. E., Mottram, J. C., et al. 2021, A&A, 648, A24 [NASA ADS] [CrossRef] [EDP Sciences] [Google Scholar]
- Vasyunin, A. I., & Herbst, E. 2013, ApJ, 769, 34 [Google Scholar]
- Whittet, D. C. B. 2003, Dust in the Galactic Environment (Bristol: Inst. Phys. Publ.) [Google Scholar]
- Whittet, D. C. B., Gerakines, P. A., Hough, J. H., & Shenoy, S. S. 2001, ApJ, 547, 872 [Google Scholar]
- Willis, E. R., & Garrod, R. T. 2017, ApJ, 840, 73 [NASA ADS] [CrossRef] [Google Scholar]
- Xu, S. C., & Wang, N. 2007, Acta Phys.-Chim. Sinica, 23, 212 [CrossRef] [Google Scholar]
All Tables
Final simulated abundances of major ice constituents as a percentage of total ice.
Peak gas-phase fractional abundances of selected organic molecules with respect to total hydrogen. A(-B) indicates A × 10−B.
All Figures
|
Fig. 1 Gas density and dust temperature in the model as a function of time. |
| In the text | |
|
Fig. 2 Fractional compositions of the main components of the ice as a function of the ice layer, in the regular model (panel a) and in the model including the C + H2O reaction (panel b). Each layer composition is determined at the moment of incorporation into the bulk ice, indicated by the top axis. The deepest ice layers are on the left, and layers closest to the ice surface are on the right. |
| In the text | |
|
Fig. 3 Fractional abundances of selected molecules with respect to total hydrogen as a function of linear time, in the regular model (panels a and c) and in the model including the C + H2O reaction (panels b and d). The top axis indicates the dust temperature evolution, which takes a minimum value of 8 K. The solid lines indicate gas-phase abundances, and dotted lines of the same colour indicate the same species on the dust grains, in the same units. |
| In the text | |
Current usage metrics show cumulative count of Article Views (full-text article views including HTML views, PDF and ePub downloads, according to the available data) and Abstracts Views on Vision4Press platform.
Data correspond to usage on the plateform after 2015. The current usage metrics is available 48-96 hours after online publication and is updated daily on week days.
Initial download of the metrics may take a while.