Fig. 3
Download original image
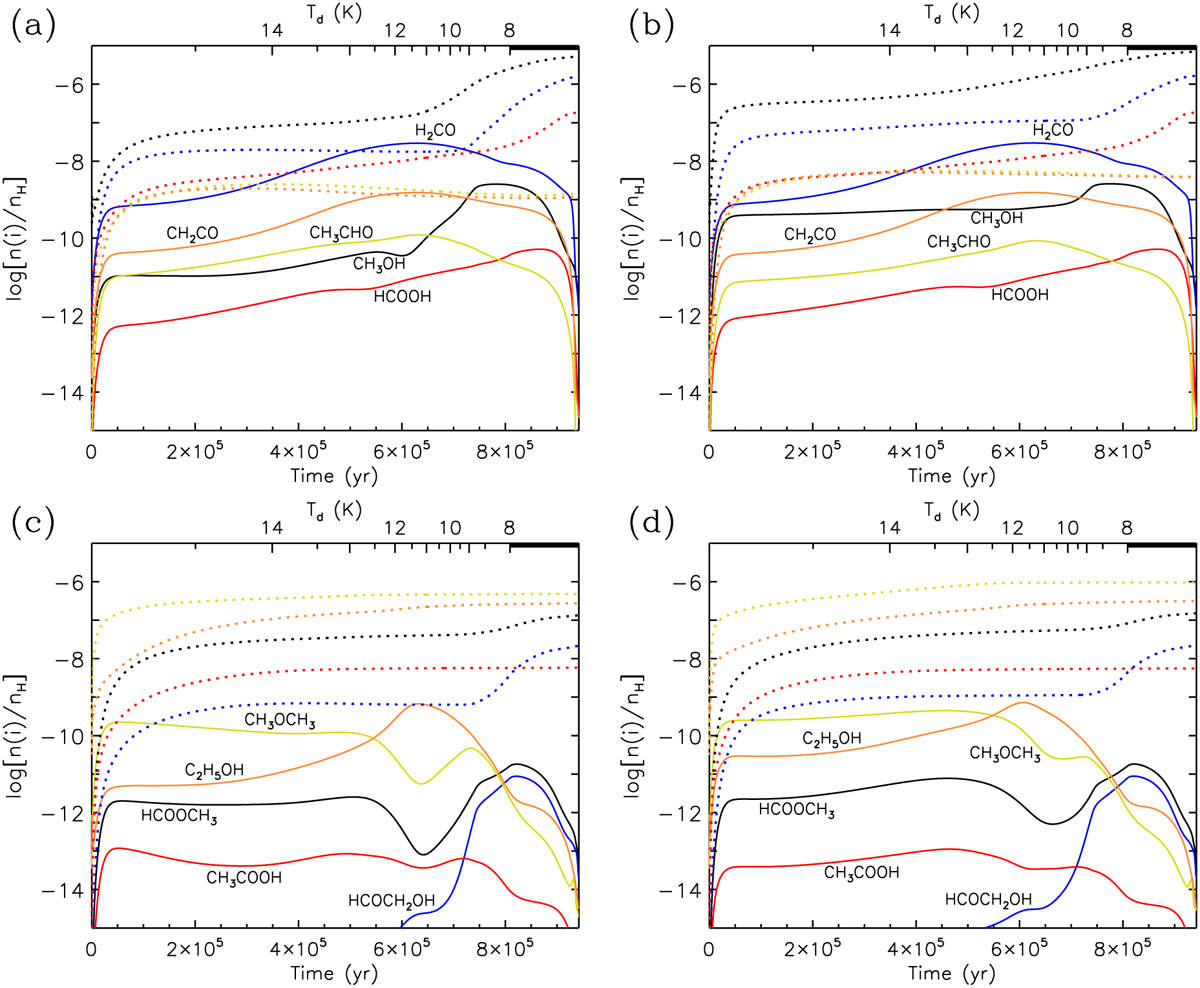
Fractional abundances of selected molecules with respect to total hydrogen as a function of linear time, in the regular model (panels a and c) and in the model including the C + H2O reaction (panels b and d). The top axis indicates the dust temperature evolution, which takes a minimum value of 8 K. The solid lines indicate gas-phase abundances, and dotted lines of the same colour indicate the same species on the dust grains, in the same units.
Current usage metrics show cumulative count of Article Views (full-text article views including HTML views, PDF and ePub downloads, according to the available data) and Abstracts Views on Vision4Press platform.
Data correspond to usage on the plateform after 2015. The current usage metrics is available 48-96 hours after online publication and is updated daily on week days.
Initial download of the metrics may take a while.