Open Access
Fig. 8
Download original image
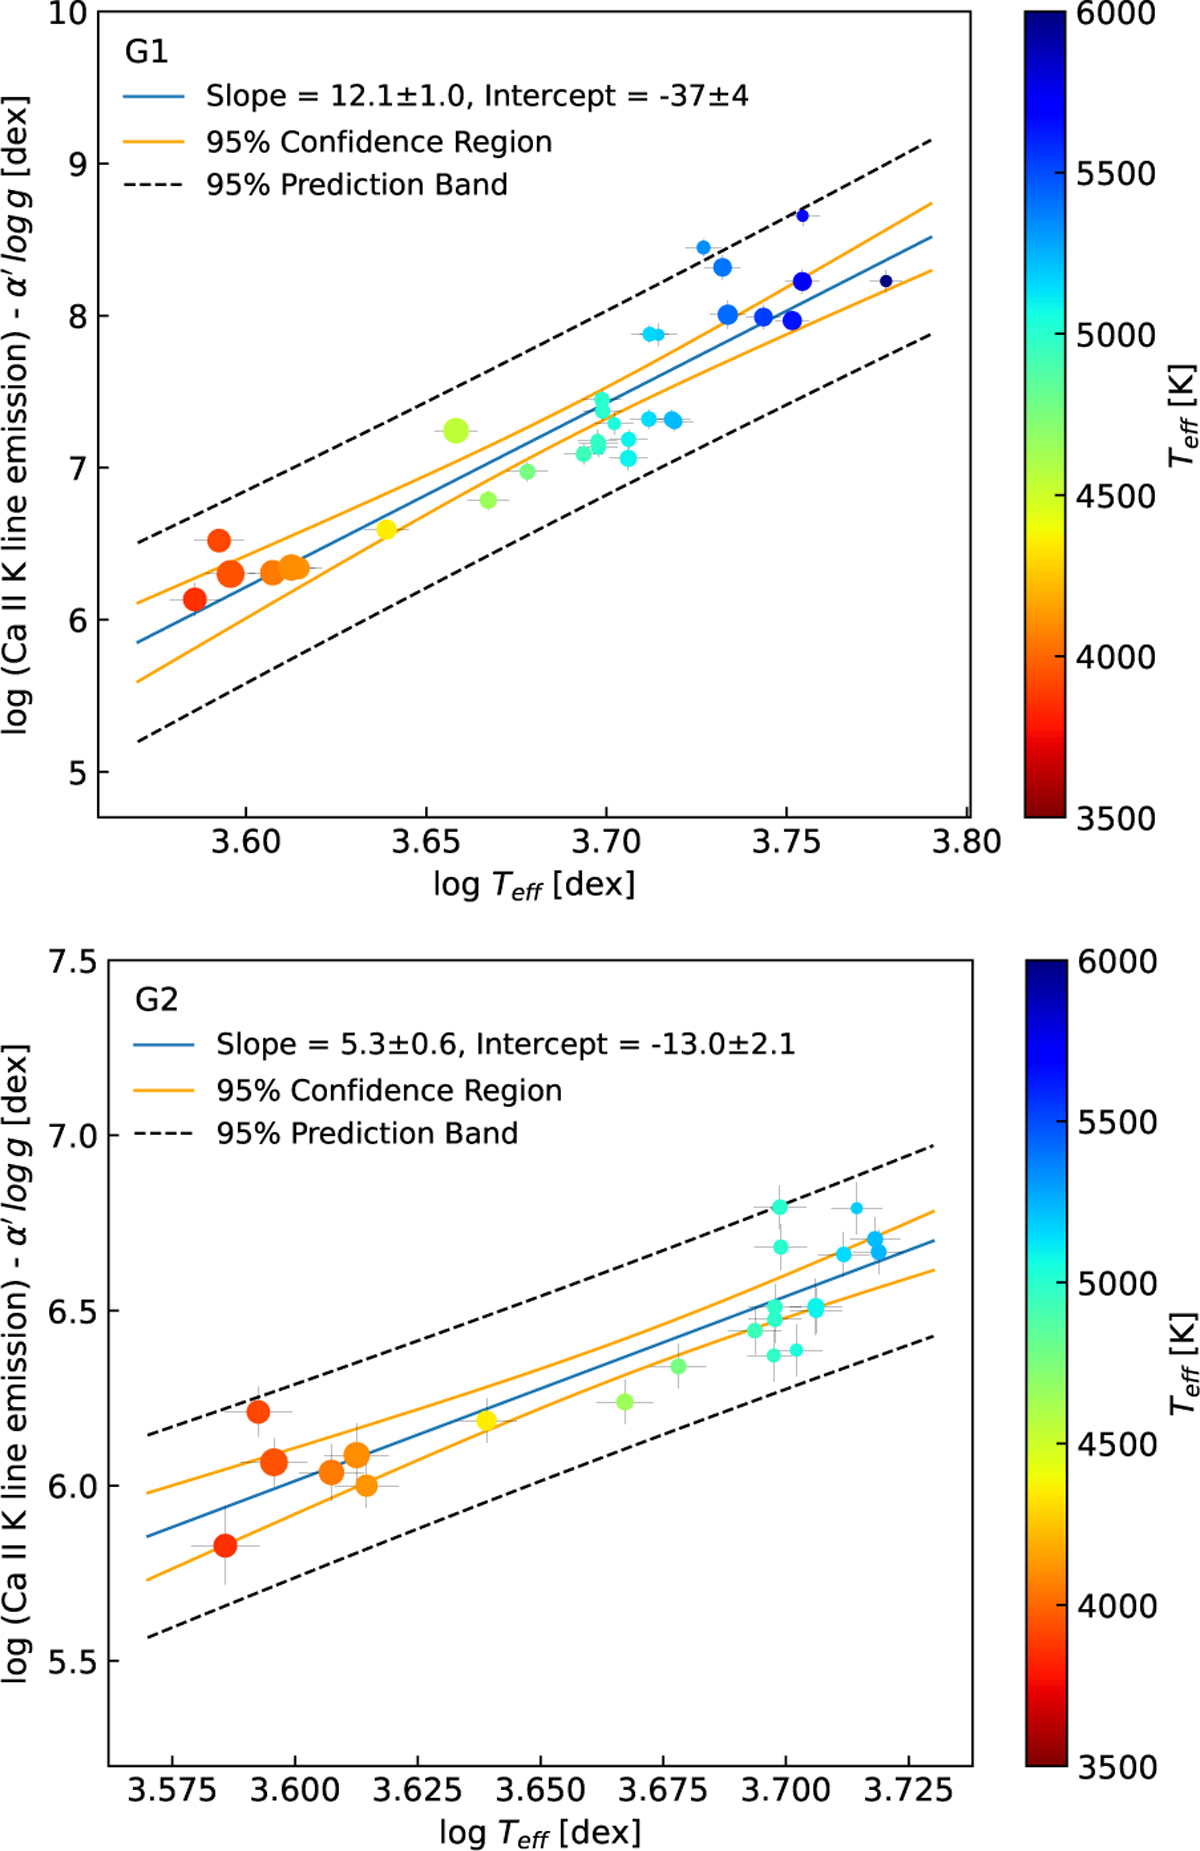
Dependence of K emission line flux of Ca II with Teff by subtracting the gravity contribution for G1 (top) and G2 (bottom) groups. The blue line corresponds to a linear fit. The color code represents the effective temperature, and the point size represents the surface gravity – larger points are for lower gravities.
Current usage metrics show cumulative count of Article Views (full-text article views including HTML views, PDF and ePub downloads, according to the available data) and Abstracts Views on Vision4Press platform.
Data correspond to usage on the plateform after 2015. The current usage metrics is available 48-96 hours after online publication and is updated daily on week days.
Initial download of the metrics may take a while.