Fig. 9
Download original image
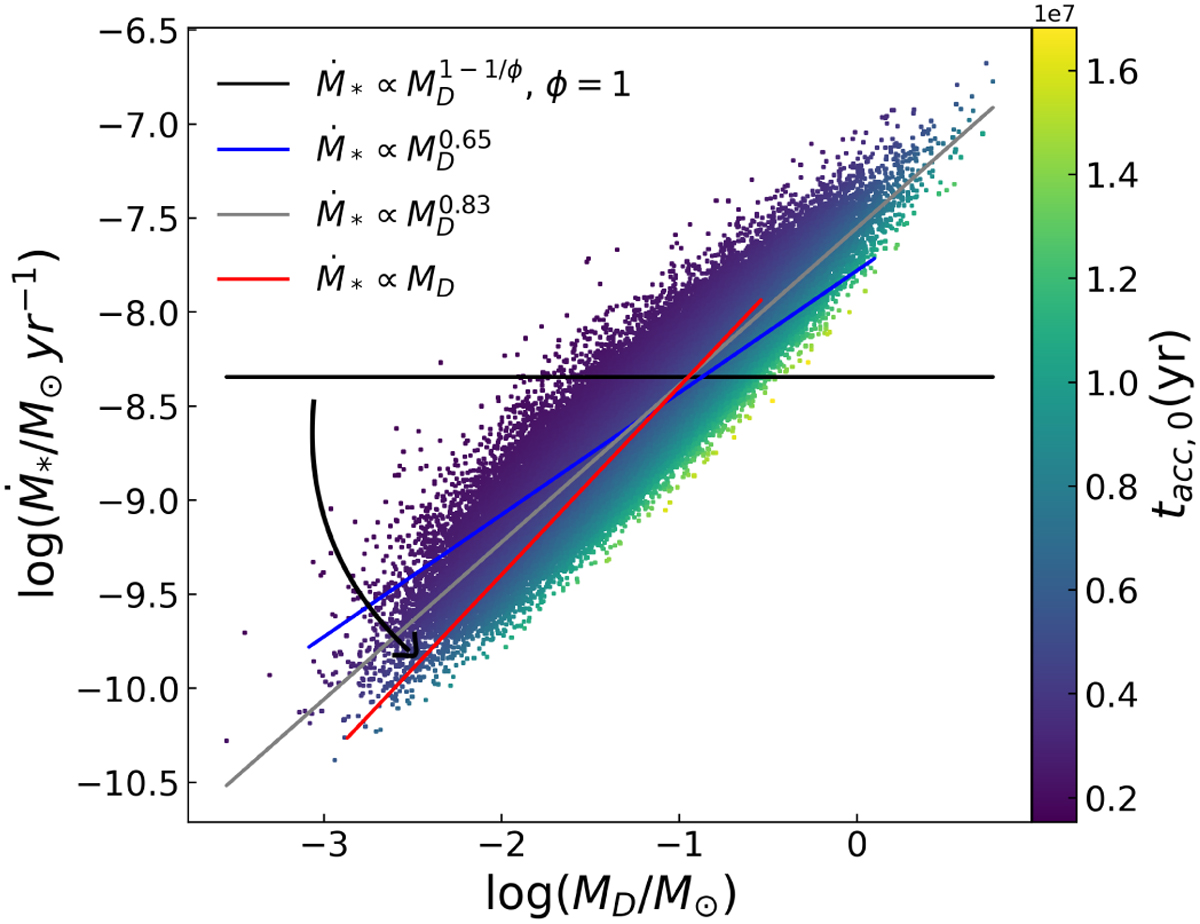
MD−Ṁ* correlation with ϕ = 1, ω = 0.8, and t = 3.5 Myr. The dots are Monte Carlo simulations of 105 proto-planetary disks evolving following Eqs. (4) and (5), where M0 follows Eq. (9) and tacc,0 follows a lognormal distribution centered on the natural logarithm of 5 Myr with a spread of 0.13 dex. In addition, M0 is then generated following a lognormal distribution with the values of tacc,0 following Eq. (9) with a spread of 0.43 dex. The black line represents Eq. (D.2), the gray line is the best-fitting power law for the population, resulting in ![]() , while the red line shows Eq. (B.2). For illustrative purposes, we also plot in blue the best-fitting power law for a population for which
, while the red line shows Eq. (B.2). For illustrative purposes, we also plot in blue the best-fitting power law for a population for which ![]() dex, which results in
dex, which results in ![]() .
.
Current usage metrics show cumulative count of Article Views (full-text article views including HTML views, PDF and ePub downloads, according to the available data) and Abstracts Views on Vision4Press platform.
Data correspond to usage on the plateform after 2015. The current usage metrics is available 48-96 hours after online publication and is updated daily on week days.
Initial download of the metrics may take a while.