Fig. 8
Download original image
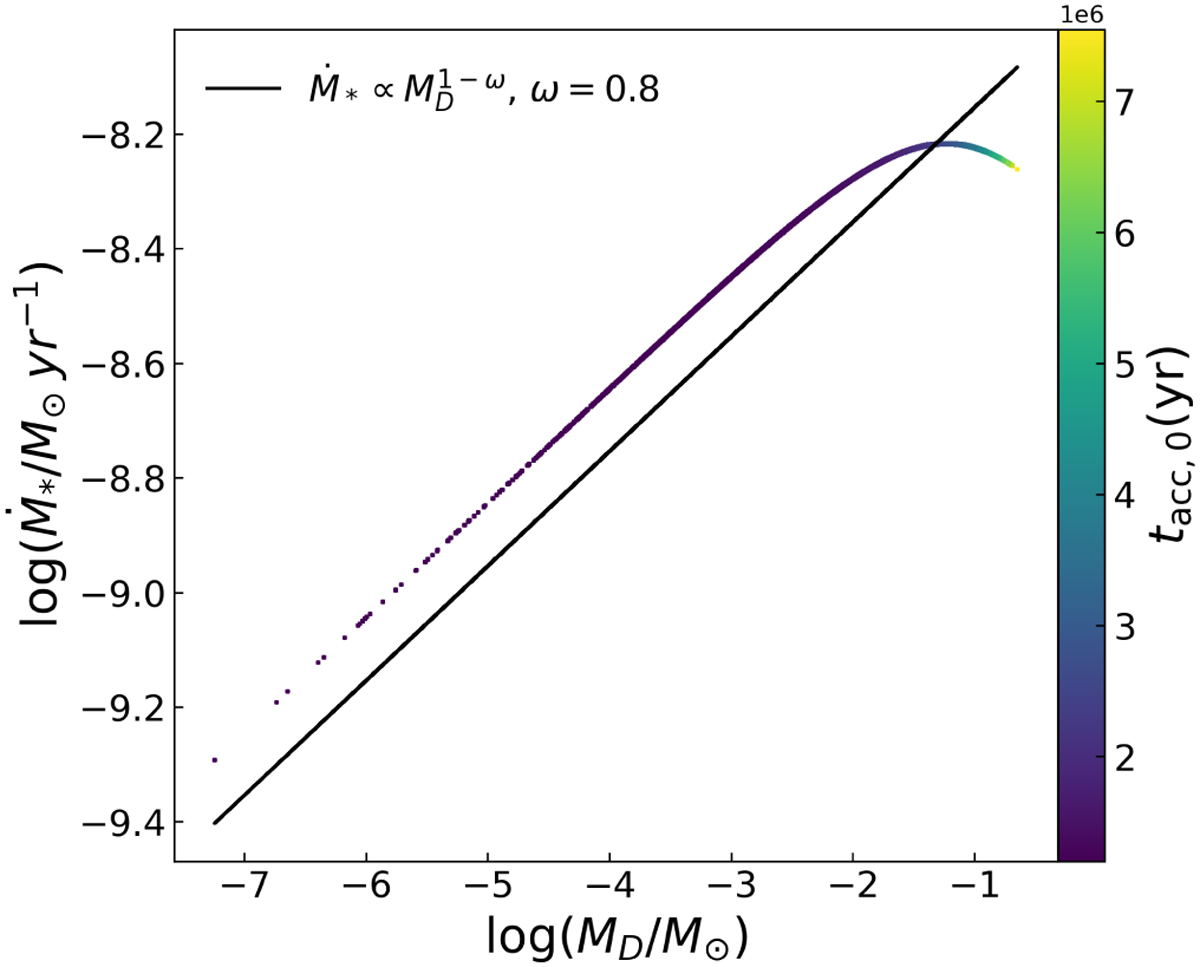
Slope of the MD−Ṁ* correlation with ϕ = 0.8, ω = 0.8, and t = 3 Myr. The colored dots are Monte Carlo simulations of 105 protoplanetary disks ruled from Eqs. (4) and (5), where M0 follows Eq. (9) and tacc,0 follows a lognormal distribution centered on the natural logarithm of 2 Myr with a spread of 0.13 dex. The black line represents Eq. (D.6).
Current usage metrics show cumulative count of Article Views (full-text article views including HTML views, PDF and ePub downloads, according to the available data) and Abstracts Views on Vision4Press platform.
Data correspond to usage on the plateform after 2015. The current usage metrics is available 48-96 hours after online publication and is updated daily on week days.
Initial download of the metrics may take a while.