Fig. 4
Download original image
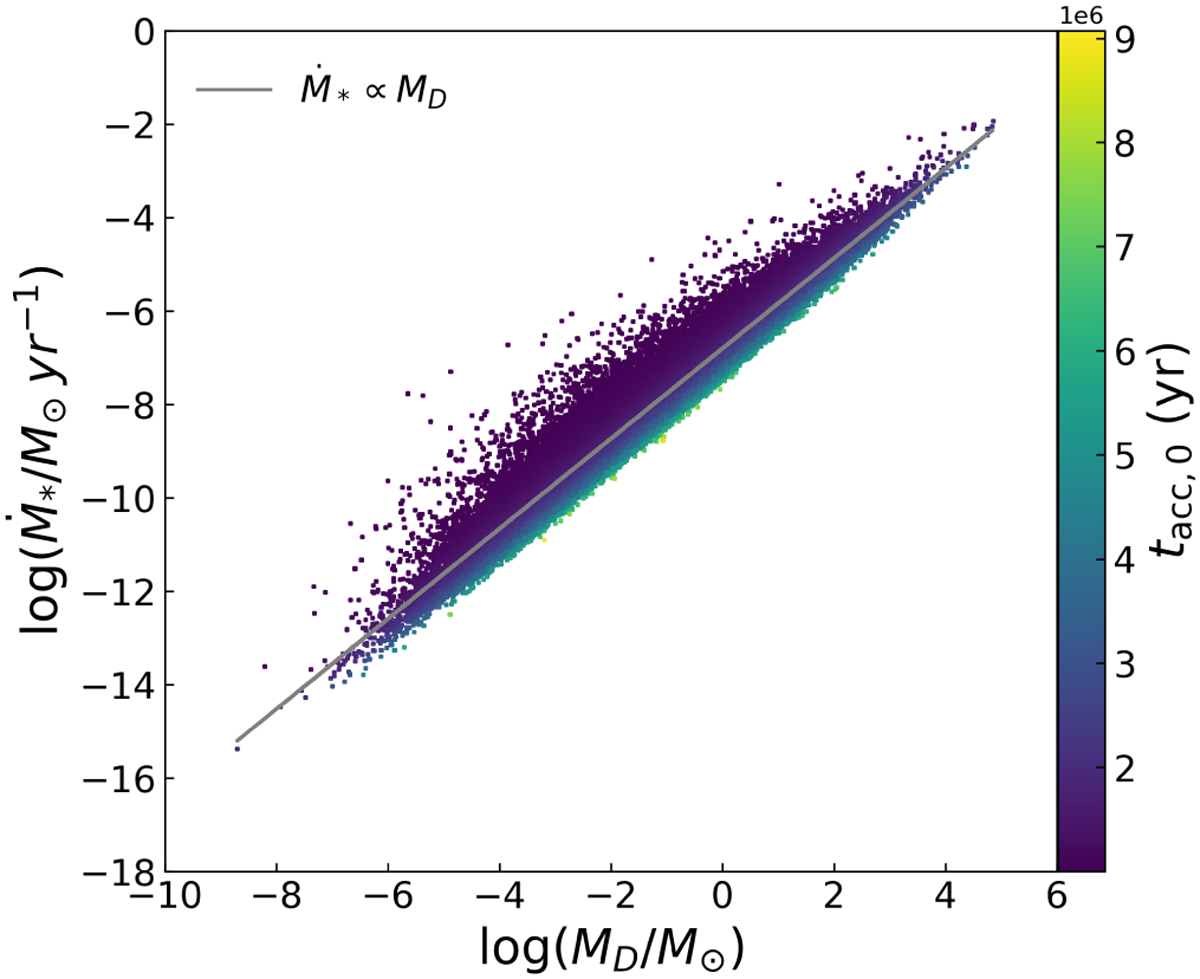
MD − Ṁ* correlation with ω = 0.8 and t = 2 Myr. The colored dots are Monte Carlo simulations of 105 proto-planetary disks evolving following Eqs. (4), (5) where M0 and tacc,0 follow a lognormal distribution centered, respectively, on 0.1 M⊙ with a spread of 1.5 dex and on 2 Myr with a spread of 0.15 dex. The gray line represents the best fit of a single power law, for which γ = 1.
Current usage metrics show cumulative count of Article Views (full-text article views including HTML views, PDF and ePub downloads, according to the available data) and Abstracts Views on Vision4Press platform.
Data correspond to usage on the plateform after 2015. The current usage metrics is available 48-96 hours after online publication and is updated daily on week days.
Initial download of the metrics may take a while.