Fig. 2
Download original image
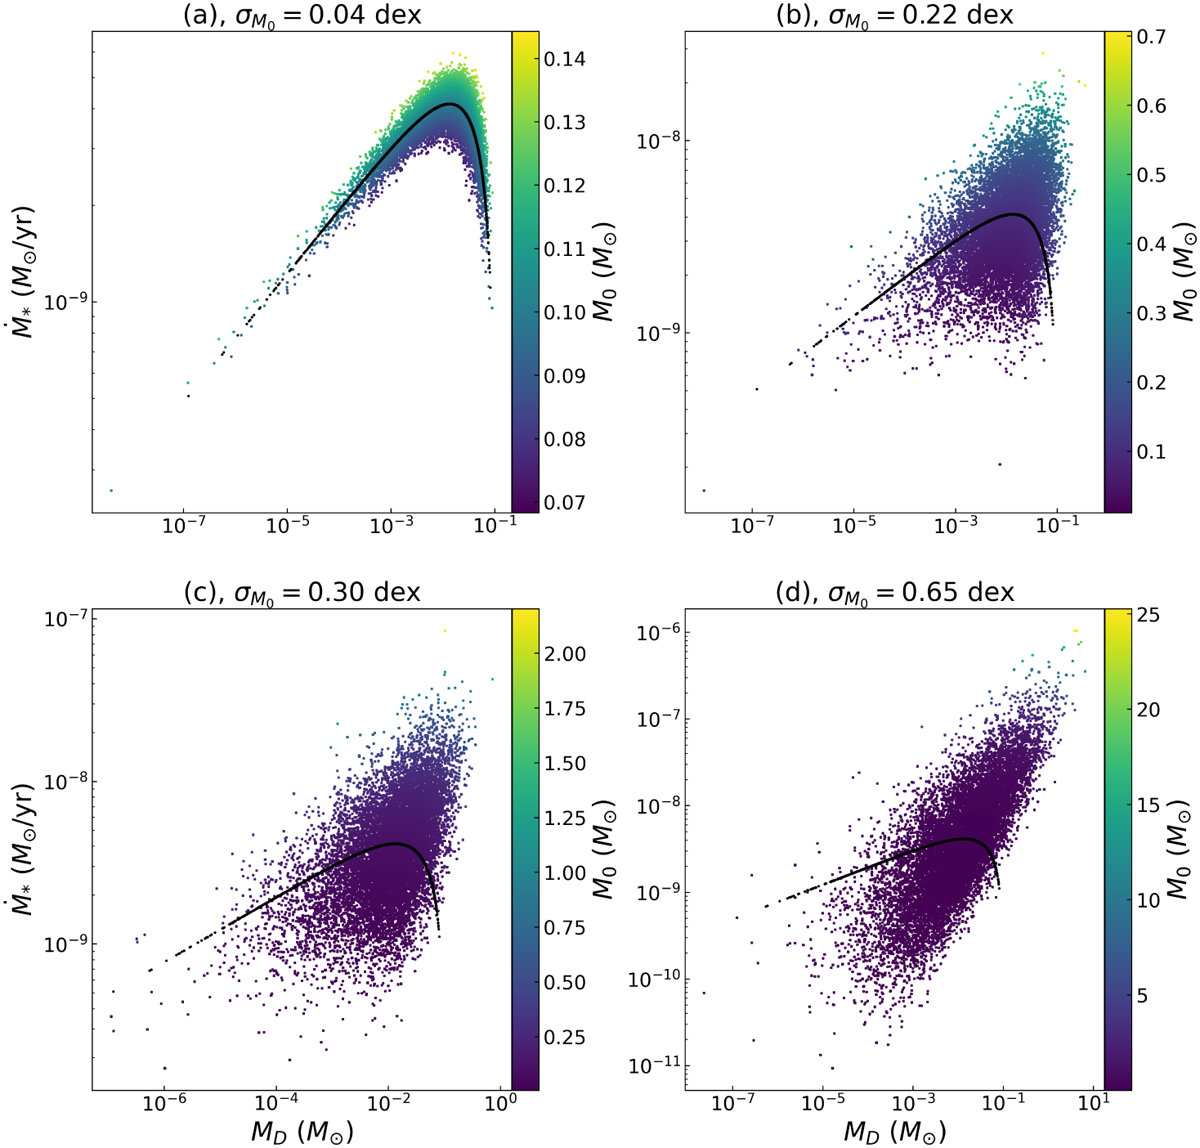
MD − Ṁ* plane for different values of ![]() . The colored dots in every plot are Monte Carlo simulations of 105 proto- planetary disks with ω = 0.8 and t = 5 Myr, evolving following Eqs. (4), (5), where M0 follows a lognormal distribution centered on the natural logarithm of 0.1 M⊙ with a spread of (a) 0.04 dex, (b) 0.22 dex, (c) 0.30 dex, (d) 0.65 dex. The black dots show the “boomerang” shape of the isochrones for a disk population with the same parameters as in the other disk populations, but with
. The colored dots in every plot are Monte Carlo simulations of 105 proto- planetary disks with ω = 0.8 and t = 5 Myr, evolving following Eqs. (4), (5), where M0 follows a lognormal distribution centered on the natural logarithm of 0.1 M⊙ with a spread of (a) 0.04 dex, (b) 0.22 dex, (c) 0.30 dex, (d) 0.65 dex. The black dots show the “boomerang” shape of the isochrones for a disk population with the same parameters as in the other disk populations, but with ![]() . For the four plots, tacc,0 follows a lognormal distribution centered on the natural logarithm of 1 Myr, with a spread of 0.26 dex.
. For the four plots, tacc,0 follows a lognormal distribution centered on the natural logarithm of 1 Myr, with a spread of 0.26 dex.
Current usage metrics show cumulative count of Article Views (full-text article views including HTML views, PDF and ePub downloads, according to the available data) and Abstracts Views on Vision4Press platform.
Data correspond to usage on the plateform after 2015. The current usage metrics is available 48-96 hours after online publication and is updated daily on week days.
Initial download of the metrics may take a while.