Fig. 12
Download original image
![]() plane with the values of the slope γ and the spread of the MD−Ṁ* correlation σ. Shown in orange are the values γ ∊ [0.5,0.9], while in light blue the values σ ∊ [0.55,0.71] dex as they confine the region of values compatible with the values found in Manara et al. (2016). The colored regions show the value of γ and σ for Monte Carlo disk populations obtained with the corresponding specific values of ϕ and
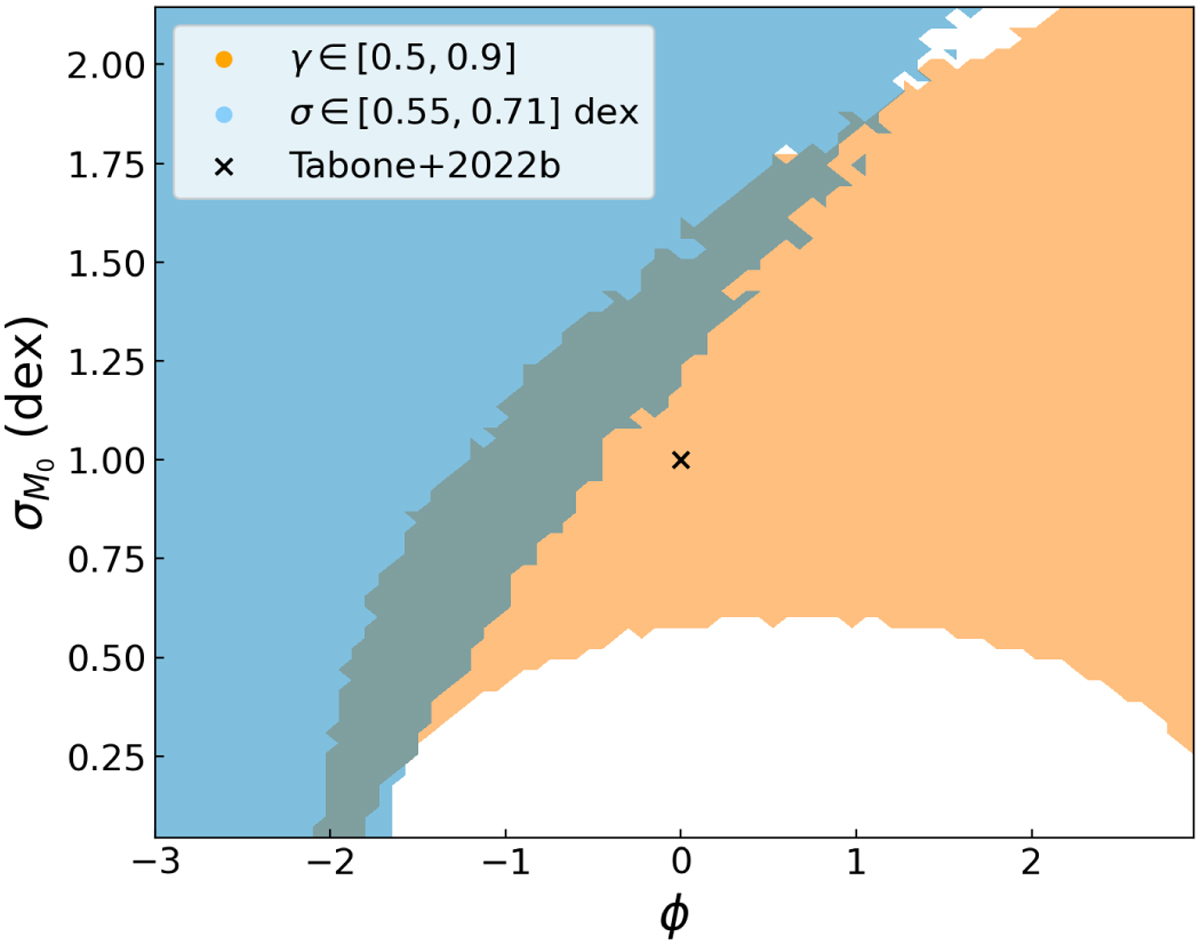
plane with the values of the slope γ and the spread of the MD−Ṁ* correlation σ. Shown in orange are the values γ ∊ [0.5,0.9], while in light blue the values σ ∊ [0.55,0.71] dex as they confine the region of values compatible with the values found in Manara et al. (2016). The colored regions show the value of γ and σ for Monte Carlo disk populations obtained with the corresponding specific values of ϕ and ![]() . Every Monte Carlo consists of 104 disks evolving according to Eqs. (4), (5), where
. Every Monte Carlo consists of 104 disks evolving according to Eqs. (4), (5), where ![]() , ω = 0.8, t = 2 Myr, and tacc,0 follows a lognormal distribution centered on the values retrieved from the fit in Sect. 4.1. The cross shows the case investigated by Tabone et al. (2022b).
, ω = 0.8, t = 2 Myr, and tacc,0 follows a lognormal distribution centered on the values retrieved from the fit in Sect. 4.1. The cross shows the case investigated by Tabone et al. (2022b).
Current usage metrics show cumulative count of Article Views (full-text article views including HTML views, PDF and ePub downloads, according to the available data) and Abstracts Views on Vision4Press platform.
Data correspond to usage on the plateform after 2015. The current usage metrics is available 48-96 hours after online publication and is updated daily on week days.
Initial download of the metrics may take a while.