Fig. 9
Download original image
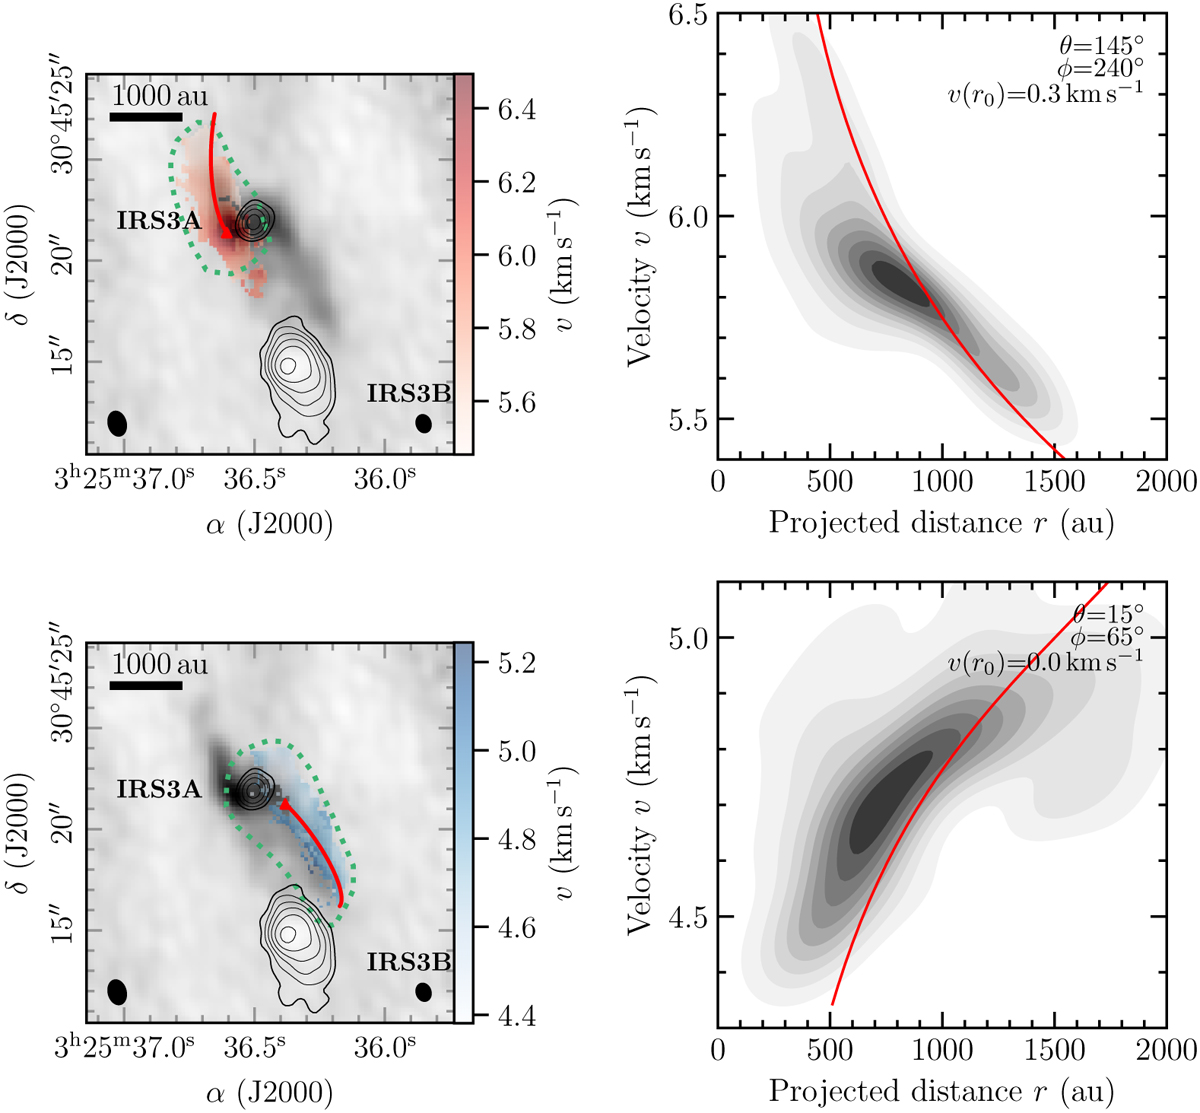
Streamline model of the red- (top) and blueshifted (bottom) sides of the gas bridge. The left panel shows the integrated intensity of DCN (3−2) in grayscale and the velocity map in color. The black contours are the 1.4 mm continuum with levels at 5, 10, 20, 40, 80, and 160×σcont (σcont=0.94 mJy beam−1). The synthesized beam of the NOEMA line and continuum data is shown in the bottom left and right panels, respectively. A scale bar is shown in the top left corner. The right panel shows the kernel density estimate of the observed velocity profile in grayscale as a function of projected distance and the streamline model in red. The projected trajectory of the streamline model is highlighted in red in the left panels as well. The position at which the streamline model reaches the centrifugal radius is marked by the red triangle.
Current usage metrics show cumulative count of Article Views (full-text article views including HTML views, PDF and ePub downloads, according to the available data) and Abstracts Views on Vision4Press platform.
Data correspond to usage on the plateform after 2015. The current usage metrics is available 48-96 hours after online publication and is updated daily on week days.
Initial download of the metrics may take a while.