Fig. 8
Download original image
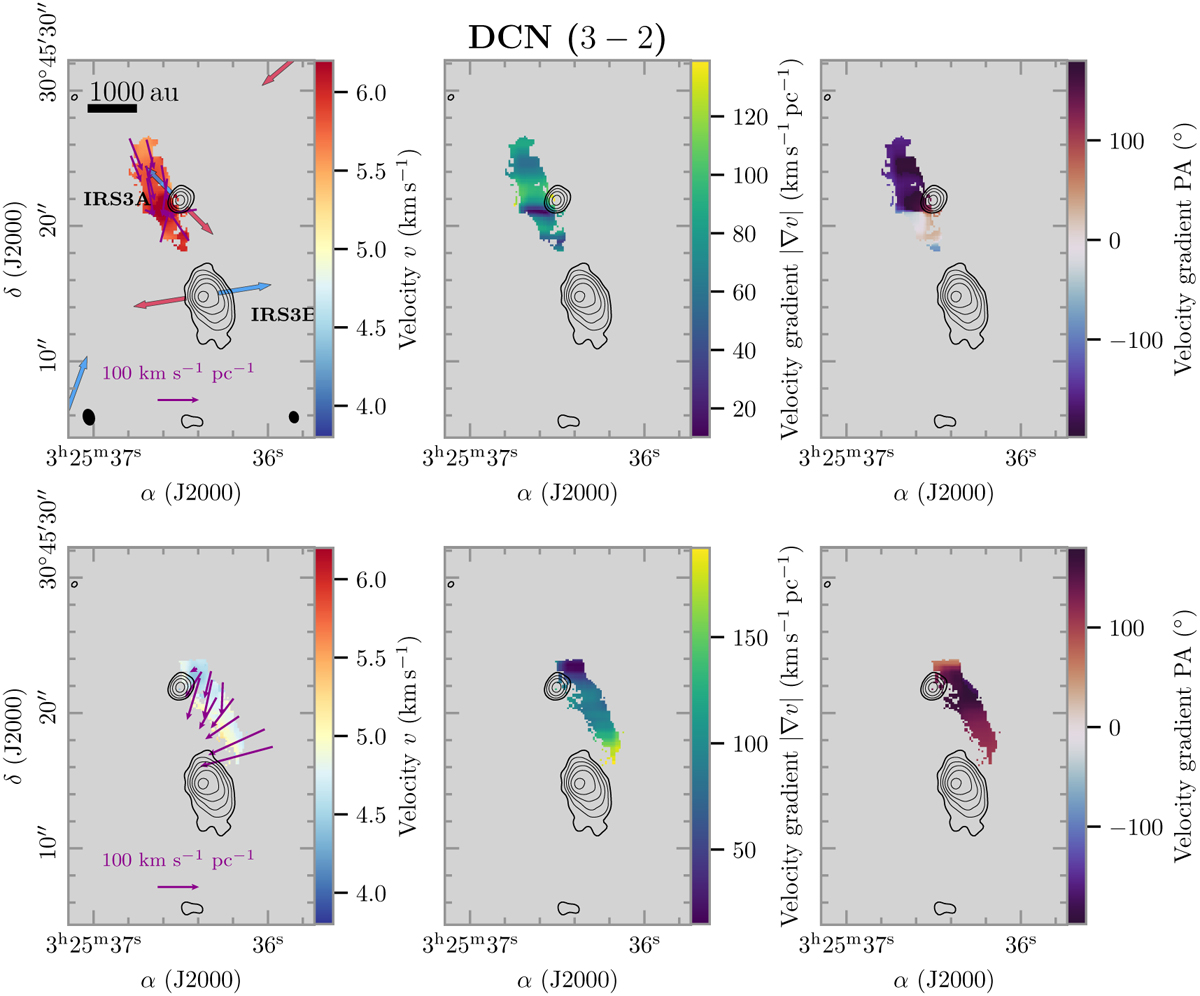
Velocity gradient maps of the red- (top) and blueshifted (bottom) part of the gas bridge. In each row, the velocity (left), velocity gradient (center), and velocity gradient PA (right) are shown in color. The black contours are the 1.4 mm continuum with levels at 5, 10, 20, 40, 80, and 160×σcont (σcont=0.94mJybeam−1). The purple arrows in the left panels indicate the direction and strength of the velocity gradient, where the arrow tip points from low to high velocities. The length of the purple arrow in the bottom left corner marks a velocity gradient of 100 km s−1pc−1. In the top left panel, the synthesized beam of the NOEMA line and continuum data are shown in the bottom left and right corner, respectively. A scale bar is shown in the top left corner, and bipolar outflow orientations are highlighted by red and blue arrows (Sect. 3.2).
Current usage metrics show cumulative count of Article Views (full-text article views including HTML views, PDF and ePub downloads, according to the available data) and Abstracts Views on Vision4Press platform.
Data correspond to usage on the plateform after 2015. The current usage metrics is available 48-96 hours after online publication and is updated daily on week days.
Initial download of the metrics may take a while.