Fig. 6
Download original image
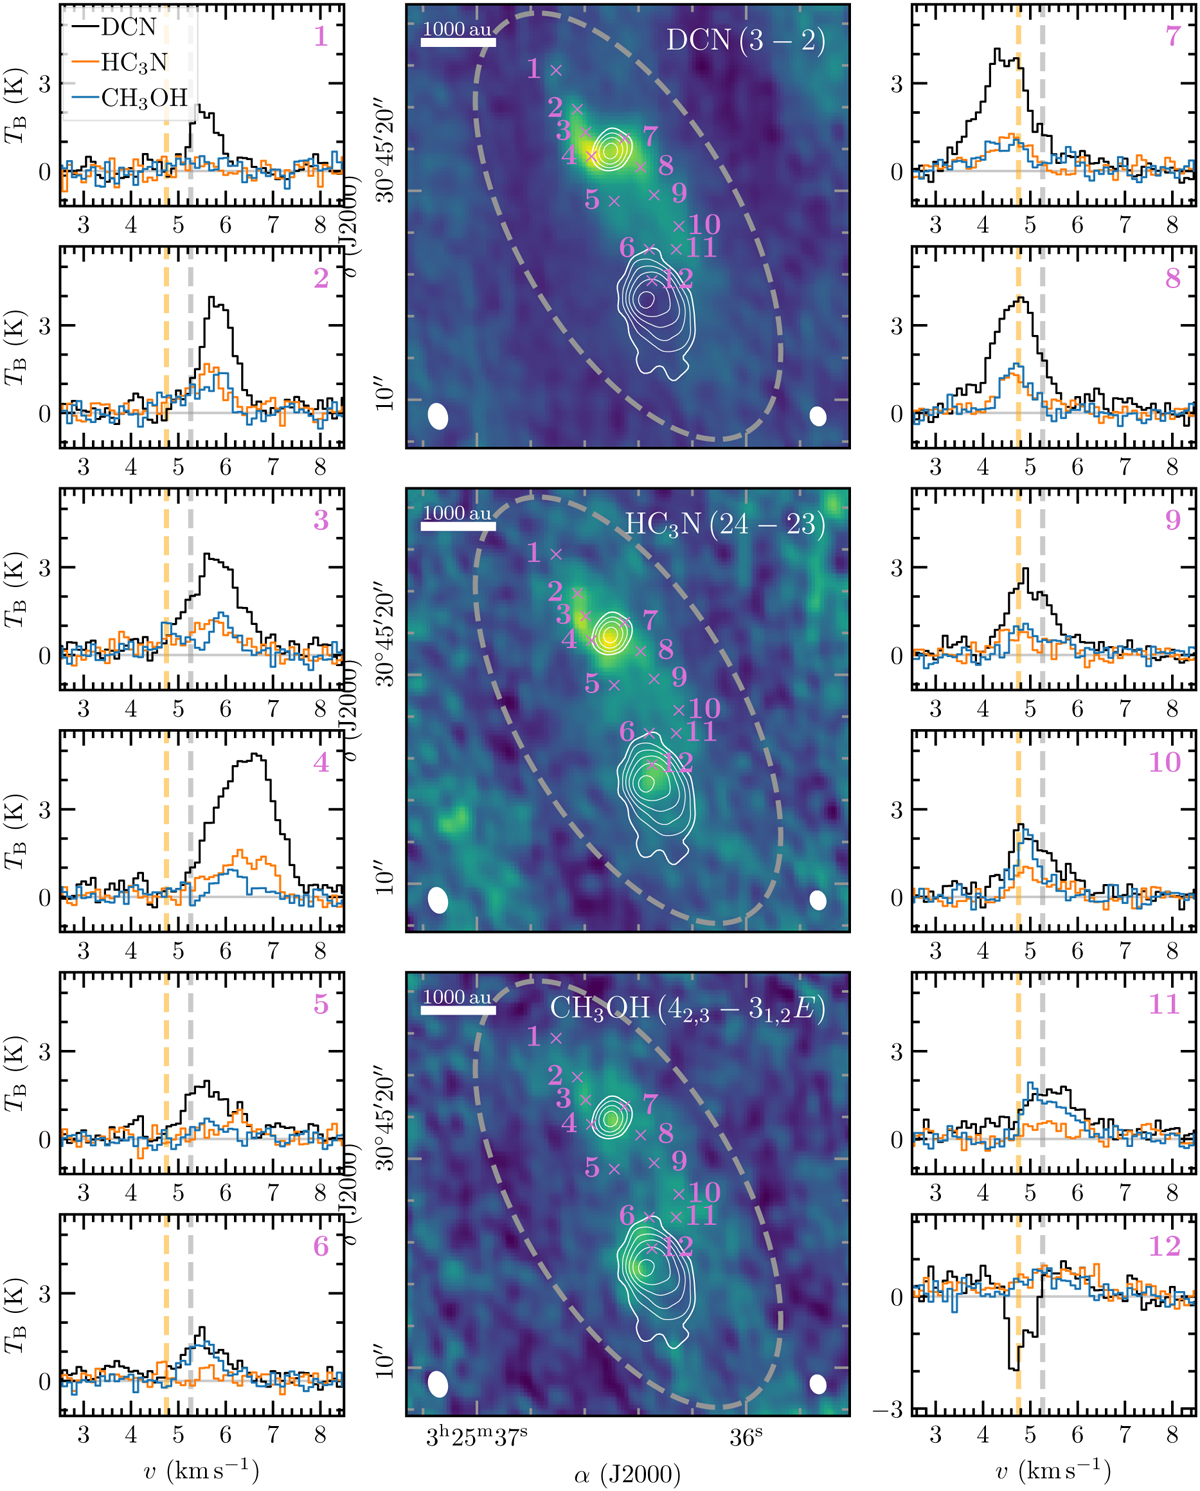
Overview of the gas bridge. In the central panels, a zoom-in of the integrated-intensity maps (Fig. 2) is shown in color (top: DCN 3–2, middle: HC3N 24–23, and bottom: CH3OH 42,3 −31,2 E). The synthesized beam of the line and continuum data is shown in the bottom left and right corners, respectively. A scale bar is presented in the top left corner. The dashed gray ellipse shows the area that is covered by the gas bridge in which the kinematic analysis was conducted. We label the positions for which spectra are shown in the left and right panels in pink (black: DCN 3–2, orange: HC3N 24–23, and blue: CH3OH 42,3 − 31,2 E). The dashed vertical gray and orange lines indicate the source velocity of IRS3A and IRS3B, respectively.
Current usage metrics show cumulative count of Article Views (full-text article views including HTML views, PDF and ePub downloads, according to the available data) and Abstracts Views on Vision4Press platform.
Data correspond to usage on the plateform after 2015. The current usage metrics is available 48-96 hours after online publication and is updated daily on week days.
Initial download of the metrics may take a while.