Fig. 1
Download original image
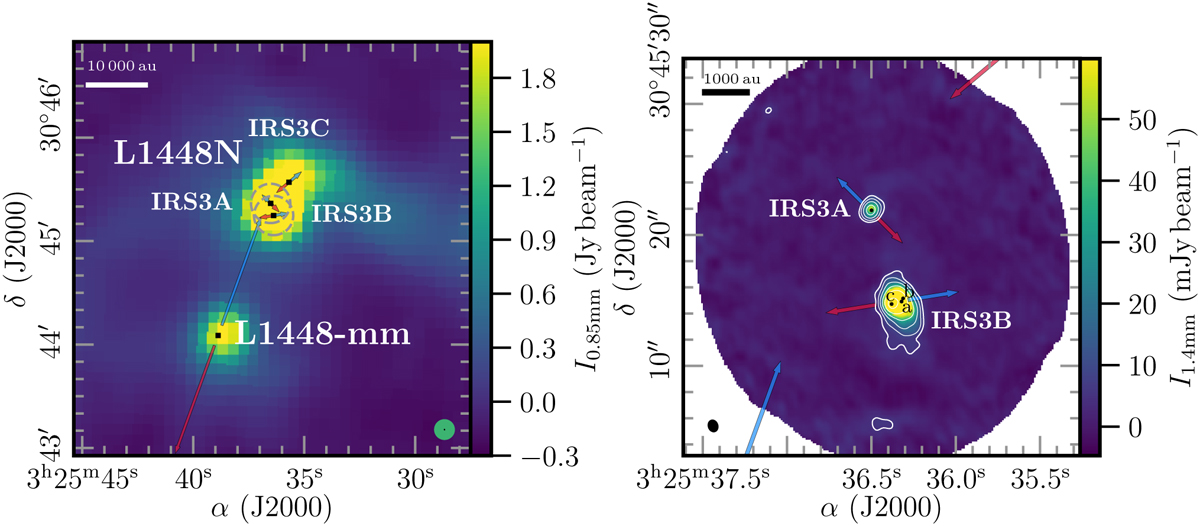
Continuum images toward L1448N. The left panel shows the JCMT 850 µm emission taken from the COMPLETE survey in color (Ridge et al. 2006; Kirk et al. 2006). The dashed gray circles show the primary beam (22″.8) of the two NOEMA pointings of the PRODIGE observations. The protostellar systems of L1448N (IRS3A, IRS3B, and IRS3C) and the nearby L1448-mm system are marked by black squares. The beam of the JCMT and NOEMA observations is shown in the bottom right corner in green and black, respectively. In the right panel, we present the 1.4 mm continuum image of the PRODIGE observations in color and white contours. The contour levels are 5, 10, 20, 40, 80, and 160×σcont (σcont=0.94mJy beam−1). The black circles mark the positions of individual protostars taken from the VANDAM survey (Tobin et al. 2016b). The synthesized beam of the NOEMA data is shown in the bottom left corner. In both panels, scale bars are marked in the top left corner, and the bipolar outflow orientations are highlighted by red and blue arrows (Sect. 3.2).
Current usage metrics show cumulative count of Article Views (full-text article views including HTML views, PDF and ePub downloads, according to the available data) and Abstracts Views on Vision4Press platform.
Data correspond to usage on the plateform after 2015. The current usage metrics is available 48-96 hours after online publication and is updated daily on week days.
Initial download of the metrics may take a while.