Fig. 7.

Download original image
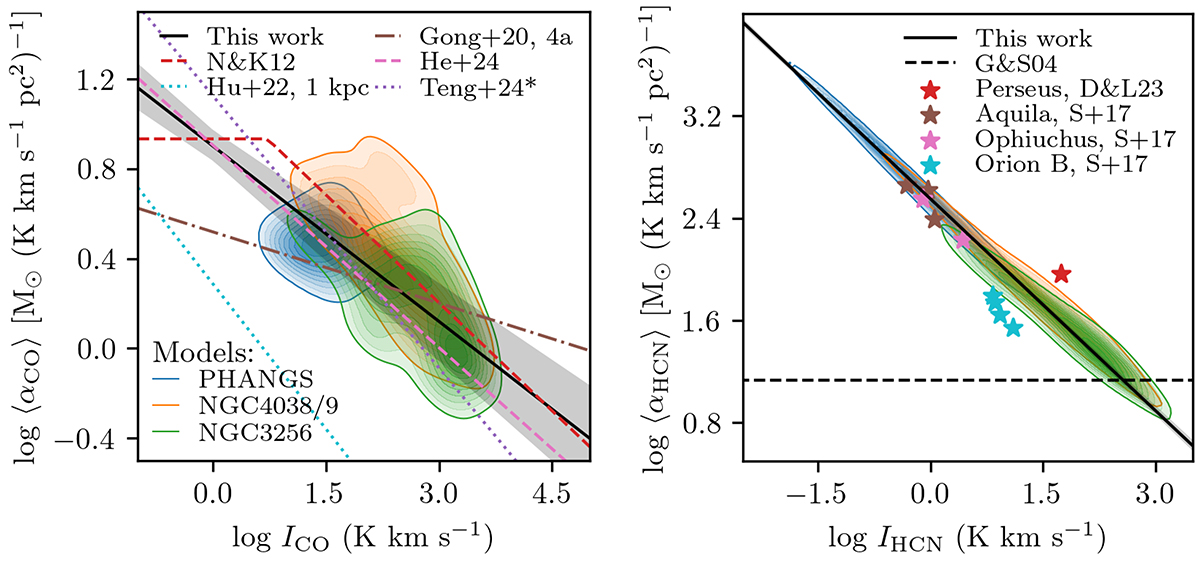
The modeled emissivities of CO and HCN in units of M⊙ (K km s−1 pc2)−1 as a function of CO and HCN intensity, respectively. Left: Inverse of the CO emissivity (in units of the CO conversion factor) as a function of CO intensity, ⟨αCO⟩=⟨ϵCO⟩−1. We include the fit to our models (Eq. (17), solid line) and the 1σ uncertainty on the fit (gray shaded area). We also include the results of several numerical studies (Narayanan et al. 2012; Hu et al. 2022a; Gong et al. 2020, red dashed line, cyan dotted line, brown dash-dotted line, respectively) as well as the results of observational studies at ∼150 pc scales in the Antennae (pink dashed line, He et al. 2024) and PHANGS galaxies (purple dotted line, Teng et al. 2024). We note that we have recast the αCO − σv fit from Teng et al. (2024) in terms of ICO using the fit between ICO and σv from our models. Right: Inverse of the HCN emissivity (in units of the HCN conversion factor) as a function of HCN intensity, ⟨αHCN⟩=⟨ϵHCN⟩−1. We include a fit to our models (Eq. (18), solid line) and the 1σ uncertainty on the fit (gray shaded area). For comparison, we include several published values of αHCN from observations of Milky Way clouds (Dame & Lada 2023; Shimajiri et al. 2017), and we show the Gao & Solomon (2004a,b) value as the black dashed line. This figure demonstrates how well our models are able to reproduce previous numerical prescriptions of αCO, as well as observationally constrained values of αCO and αHCN. The formatting of the model output is the same as in Fig. 3.
Current usage metrics show cumulative count of Article Views (full-text article views including HTML views, PDF and ePub downloads, according to the available data) and Abstracts Views on Vision4Press platform.
Data correspond to usage on the plateform after 2015. The current usage metrics is available 48-96 hours after online publication and is updated daily on week days.
Initial download of the metrics may take a while.


