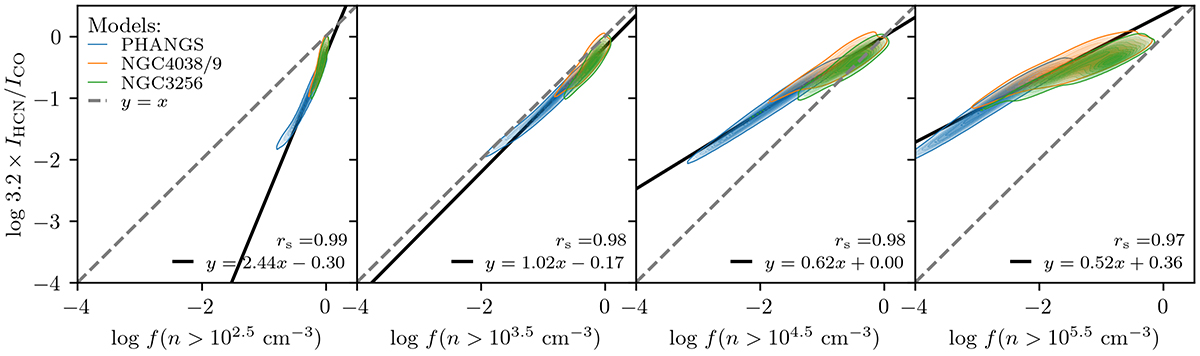
Fig. 6.
Download original image
3.2 × IHCN/ICO as a function of the fraction of gas above (from left to right) n ∼ 102.5, 103.5, 104.5, and 105.5 cm−3. The formatting is the same as in Fig. 3. The fits are shown as the solid black line (see legend). The modeled IHCN/ICO scales most directly (has a slope closest to unity) with f(n > 103.5 cm−3), supporting previous findings that this line ratio is sensitive to gas above moderate densities. Although not shown here, the same is found when comparing the emissivity ratio, ⟨ϵHCN⟩/⟨ϵCO⟩, with the same gas fractions. The Spearman rank coefficients are shown in the lower right corner of each plot.
Current usage metrics show cumulative count of Article Views (full-text article views including HTML views, PDF and ePub downloads, according to the available data) and Abstracts Views on Vision4Press platform.
Data correspond to usage on the plateform after 2015. The current usage metrics is available 48-96 hours after online publication and is updated daily on week days.
Initial download of the metrics may take a while.