Fig. 5.
Download original image
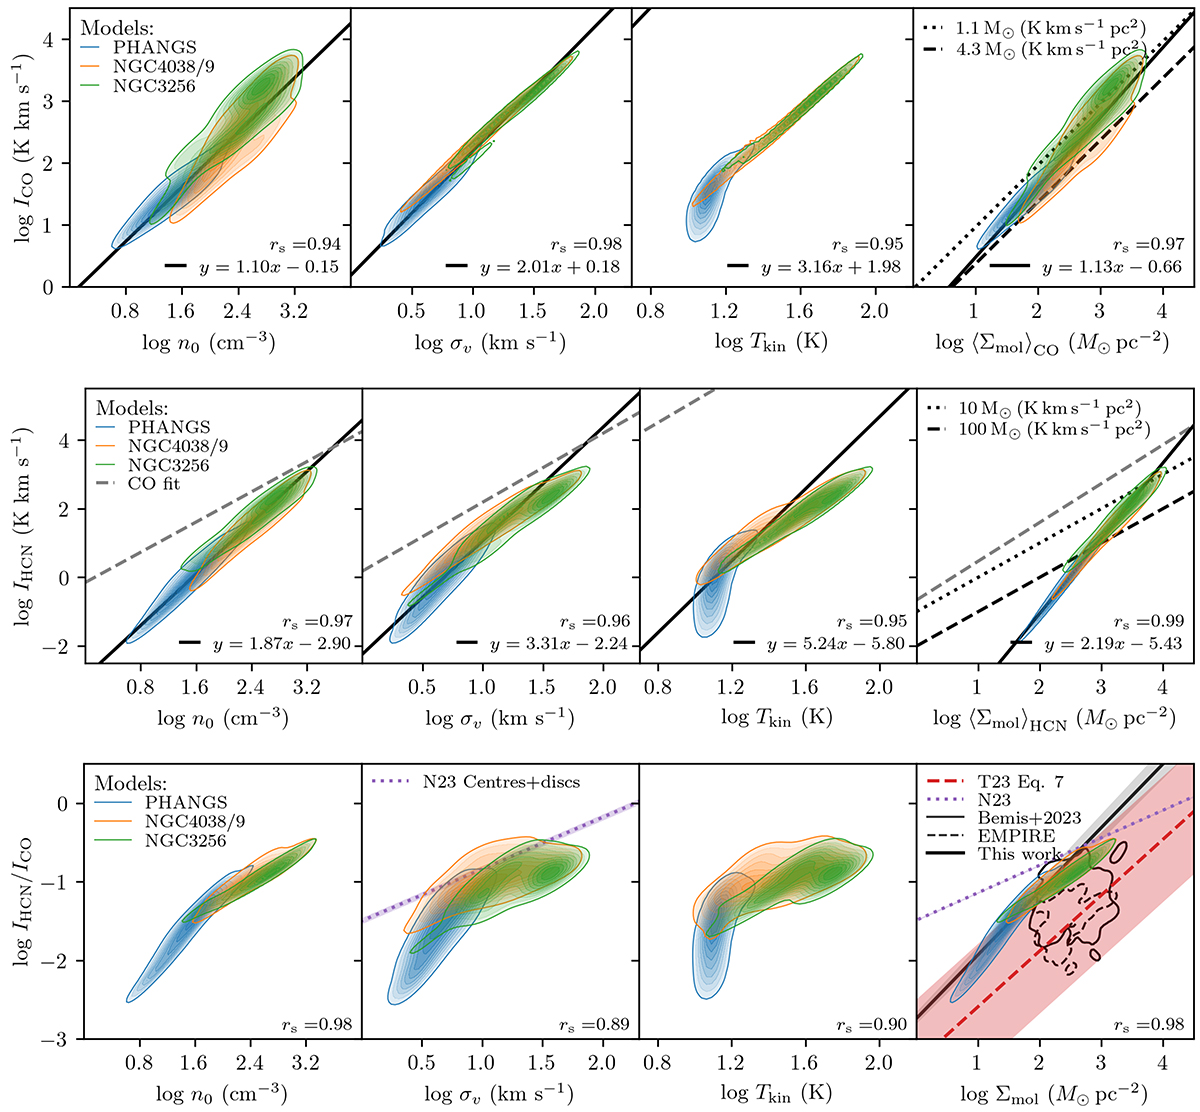
CO intensity (top row), the HCN intensity (center row), and HCN/CO ratio (bottom row) as a function of mean gas density, velocity dispersion, kinetic temperature, and gas column density. The column densities shown are from Eq. (12) for ICO and IHCN (top and center rows) and are the fiducial model column densities for the HCN/CO ratio (bottom row). The reference conversion factor values are shown in the intensity vs. column density plots as the dotted and dashed lines. We show the CO fits (top row) in the HCN plots (center row) as the gray dashed lines. Spearman rank coefficients are shown in the lower right corner. The formatting is the same as in Fig. 3. We plot fits from the results of the ALMOND survey (purple dotted line, Neumann et al. 2023) and Tafalla et al. (2023, red dashed line). Uncertainties on their respective fits are shown as the shaded areas. For comparison, we plot the results of Paper I sample (solid contours) and the EMPIRE sample (dashed contours, Jiménez-Donaire et al. 2019) in the HCN/CO ratio vs. gas surface density plot. Our models show strong positive correlations between the modeled line intensities and mean density, velocity dispersion, mean kinetic temperature, and gas column densities. IHCN appears to increase more rapidly with each of these parameters compared to ICO. The Spearman rank coefficients are shown in the lower right corner of each plot.
Current usage metrics show cumulative count of Article Views (full-text article views including HTML views, PDF and ePub downloads, according to the available data) and Abstracts Views on Vision4Press platform.
Data correspond to usage on the plateform after 2015. The current usage metrics is available 48-96 hours after online publication and is updated daily on week days.
Initial download of the metrics may take a while.