Fig. 4.
Download original image
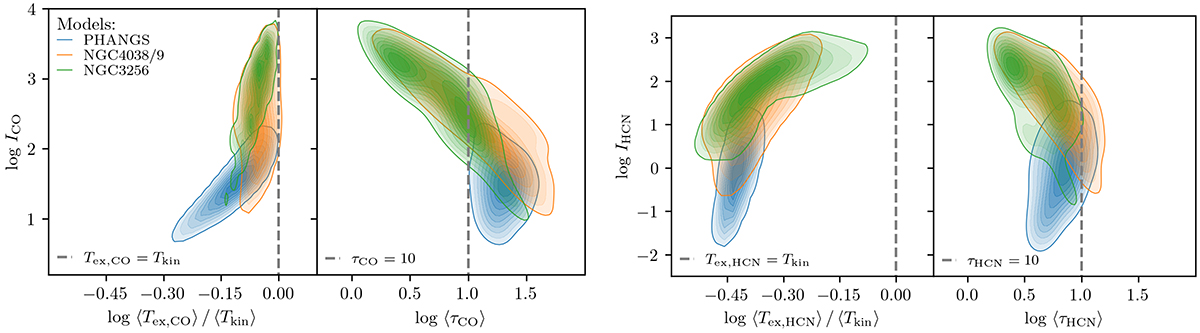
Correlations between modeled ICO (left two plots) and IHCN (right two plots) and their respective excitation temperatures and optical depths determined using Eqs. (13) and (14). The formatting is the same as in Fig. 3. We find that CO optical depth decreases with increasing ICO and CO excitation, in general agreement with the findings of previous studies (e.g., Bolatto et al. 2013; Narayanan et al. 2012; Narayanan & Krumholz 2014). In our models, HCN appears subthermally excited and moderately optically thick, also in agreement with the findings of previous studies (e.g., Dame & Lada 2023; Jiménez-Donaire et al. 2017).
Current usage metrics show cumulative count of Article Views (full-text article views including HTML views, PDF and ePub downloads, according to the available data) and Abstracts Views on Vision4Press platform.
Data correspond to usage on the plateform after 2015. The current usage metrics is available 48-96 hours after online publication and is updated daily on week days.
Initial download of the metrics may take a while.