Fig. C.1.
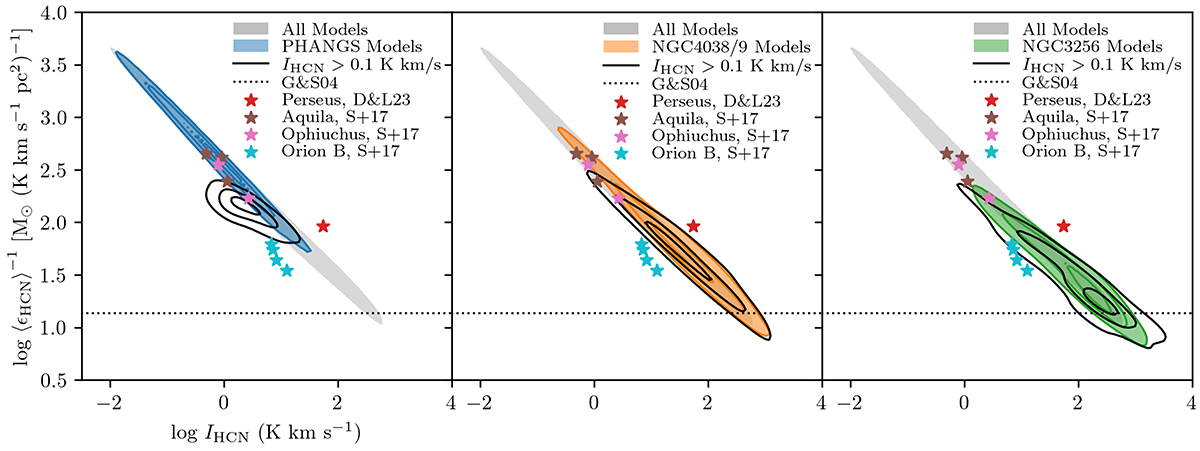
Download original image
Inverse of the HCN emissivity (in units of the HCN conversion factor) as a function of HCN intensity. We plot the PHANGS-, NGC 4038/9-, and NGC 3256-type models from left to right as the blue, orange, and green filled contours. The black contours represent ⟨ϵHCN⟩−1 for the models where we make a cut at 0.1 K km s−1, which is analogous to a sensitivity limit in observations. For comparison, we also show the Gao & Solomon (2004a,b) value as the black, dotted horizontal line and several published values of αHCN from observations of Milky Way clouds (Dame & Lada 2023; Shimajiri et al. 2017). The gray, filled contour represents all models. We find the HCN emissivities from the PHANGS-type models to be most strongly impacted by a sensitivity cut. These models appear to have artificially lower ⟨ϵHCN⟩−1 (higher emissivity) as a result of the cut.
Current usage metrics show cumulative count of Article Views (full-text article views including HTML views, PDF and ePub downloads, according to the available data) and Abstracts Views on Vision4Press platform.
Data correspond to usage on the plateform after 2015. The current usage metrics is available 48-96 hours after online publication and is updated daily on week days.
Initial download of the metrics may take a while.