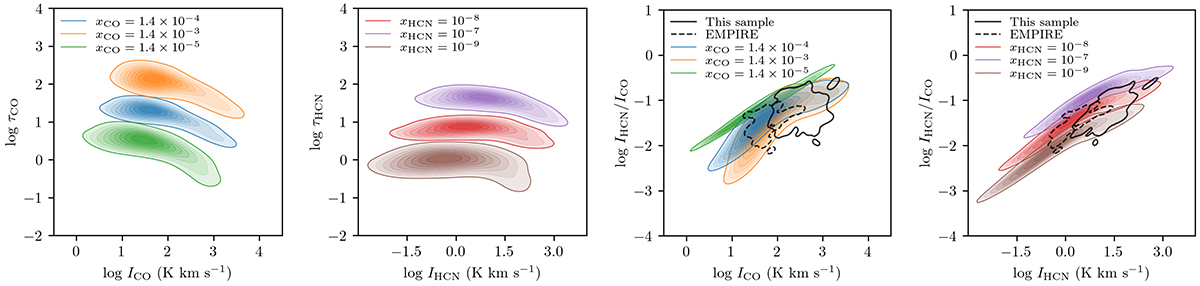
Fig. B.1.
Download original image
The effect of molecular abundance variations on optical depth and intensity. Left: Modeled CO optical depth as a function of CO intensity for xCO = 1.4 × 10⁻⁵ (green contours) xCO = 1.4 × 10⁻⁴ (blue contours) xCO = 1.4 × 10⁻³ (orange contours). Left center: Modeled HCN optical depth as a function of HCN intensity for xHCN = 10−9 (brown contours), xHCN = 10−8 (red contours), and xHCN = 10−7 (purple contours). Right center: Modeled HCN/CO intensity ratio as a function of CO optical depth for varying CO abundance. The HCN intensities are for xHCN = 10−8. Right: Modeled HCN/CO intensity ratio as a function of CO optical depth for varying HCN abundance. The CO intensities are for xCO = 1.4 × 10⁻⁴. Ten contours are drawn in even steps from the 16th to 100th percentile. Contours are shown in the right two panels for our sample of galaxies and the EMPIRE sample as the solid black and dashed black contours, respectively.
Current usage metrics show cumulative count of Article Views (full-text article views including HTML views, PDF and ePub downloads, according to the available data) and Abstracts Views on Vision4Press platform.
Data correspond to usage on the plateform after 2015. The current usage metrics is available 48-96 hours after online publication and is updated daily on week days.
Initial download of the metrics may take a while.