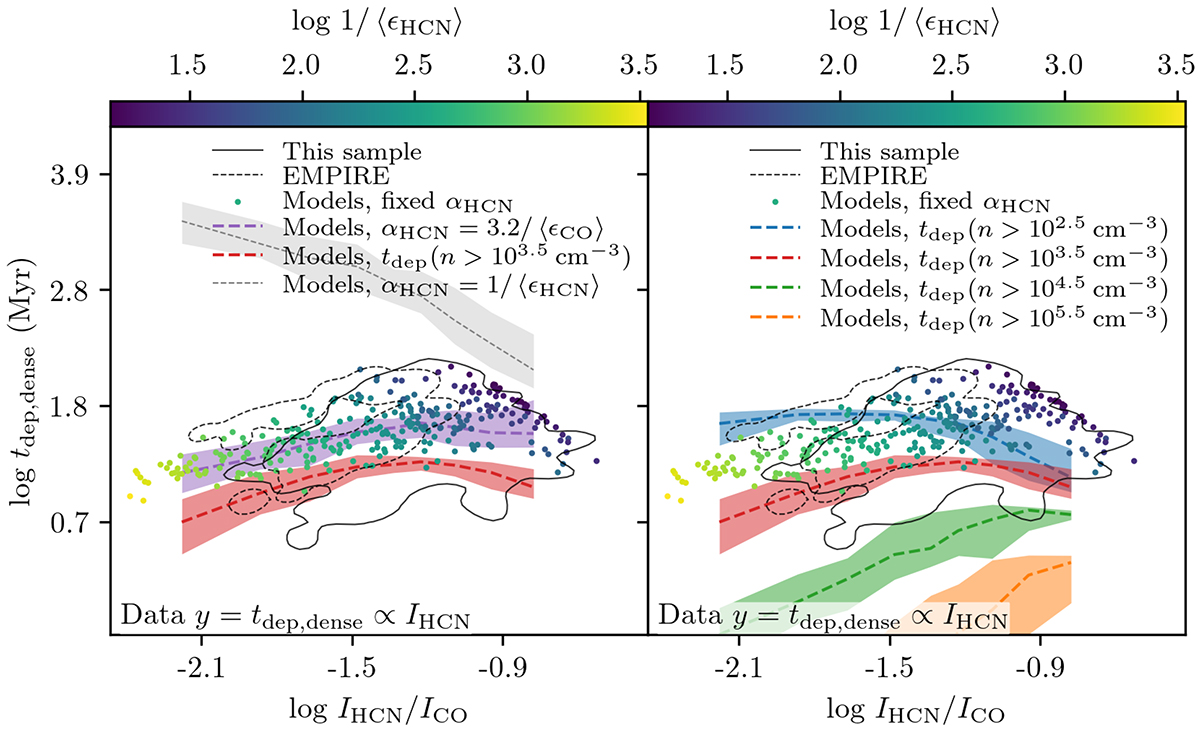
Fig. 11.
Download original image
Comparisons between theoretical predictions and our radiative transfer modeling of the relationships between tdep, dense and IHCN/ICO. Left: Model dense gas depletion time as a function of HCN/CO ratio shown three ways: (1) using modeled IHCN and a fixed HCN conversion factor for gas surface density estimates (colored points), (2) using the theoretical depletion time of the fraction of gas above n > 103.5 cm−3 (red line), and (3) using modeled IHCN with ⟨αHCN⟩ = 3.2⟨αCO⟩ applied to estimate dense gas surface density (purple line). We also show the resulting trend using modeled IHCN with ⟨αHCN⟩ = 1/⟨ϵHCN⟩ (gray dashed line) for comparison. Right: Model dense gas depletion time plotted as a function of HCN/CO ratio shown three ways, this time overlaying depletion times of several fractions of gas: that above n > 102.5, 103.5, 104.5, 105.5, cm−3 (blue, red, green, and orange lines, respectively) as a function of the HCN/CO ratio. The shaded regions represent the full range of model scatter. We find that the HCN emissivity does not appear to contribute to the scatter of these relationships in the way that CO contributes to those in Fig. 10, which is likely due to the stronger dependence of HCN emissivity on excitation relative to optical depth. Additionally, the trend in dense gas depletion time with the HCN/CO ratio depends critically on the assumed HCN conversion factor. This figure also demonstrates that the HCN emissivity does not necessarily track the mass of star-forming gas (gray trend in the left panel), but that applying ⟨αHCN⟩ = 3.2⟨αCO⟩ to IHCN when estimating tdep, dense does a reasonable job at reproducing the depletion time of gas above moderate gas densities (red lines, both panels; see also Figs. 6 and 7 and Sect. 3.4).
Current usage metrics show cumulative count of Article Views (full-text article views including HTML views, PDF and ePub downloads, according to the available data) and Abstracts Views on Vision4Press platform.
Data correspond to usage on the plateform after 2015. The current usage metrics is available 48-96 hours after online publication and is updated daily on week days.
Initial download of the metrics may take a while.