Fig. 1.
Download original image
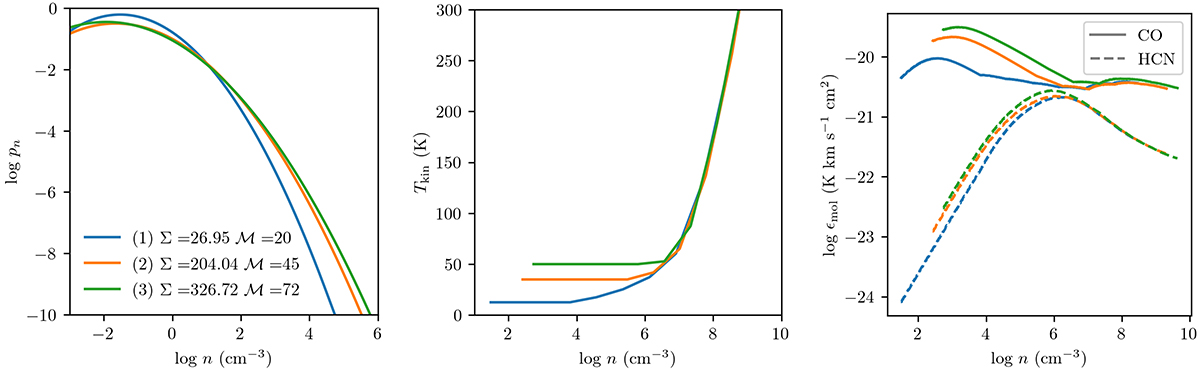
Three models that are representative of clouds in (1) the PHANGS sample (NGC 2903), (2) NGC 4038/9, and (3) NGC 3256. Left: Example n–PDFs from our model parameter space assuming αPL = 3. Center: Temperature profiles of the example models. Right: Emissivity profiles of the example models. CO emissivity is shown as solid lines, and HCN emissivity is shown as dashed lines. The mass-weighted emissivity, ⟨ϵmol⟩, is given by Eq. (11). The range of densities over which radiative transfer is applied is slightly different between models, and depends on the average gas surface density of the model (see Sect. 2.3). We plot pn over a wider range of volume densities (left plot) than those used when performing radiative transfer (center and right plots).
Current usage metrics show cumulative count of Article Views (full-text article views including HTML views, PDF and ePub downloads, according to the available data) and Abstracts Views on Vision4Press platform.
Data correspond to usage on the plateform after 2015. The current usage metrics is available 48-96 hours after online publication and is updated daily on week days.
Initial download of the metrics may take a while.