Fig. 3.
Download original image
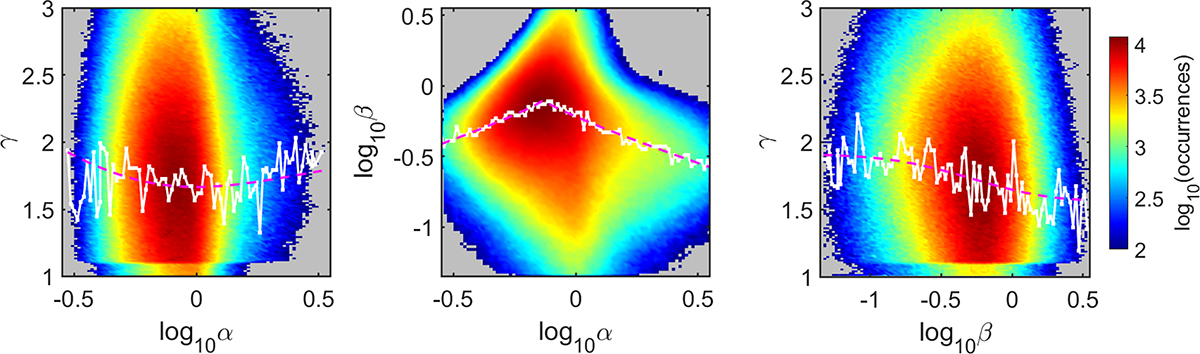
Two-dimensional histograms of the αβγ interrelationship. Left panel: Two-dimensional histogram of γ and log10(α). The white solid line shows the most frequent value of γ in each log10(α), while the magenta dashed line shows the predicted γ using the theoretical model of Livadiotis & Nicolaou (2021). Middle panel: Two-dimensional histogram of log10(β) and log10(α). The white solid line shows the most frequent value of log10(β) in each log10(α), while the magenta dashed line shows the predicted log10(β) using the function: log10β = log10β0 + λ ⋅ |log10α−log10α0|δ. Right panel: Two-dimensional histogram of γ and log10(β). The white solid line shows the most frequent value of γ in each log10(β), while the magenta dashed line shows the predicted γ using a non-linear fitting by substituting the previous function to the theoretical model of Livadiotis & Nicolaou (2021). In all panels the logarithm of occurrence in each bin is colour-coded in red corresponding to 10 000 values.
Current usage metrics show cumulative count of Article Views (full-text article views including HTML views, PDF and ePub downloads, according to the available data) and Abstracts Views on Vision4Press platform.
Data correspond to usage on the plateform after 2015. The current usage metrics is available 48-96 hours after online publication and is updated daily on week days.
Initial download of the metrics may take a while.