Open Access
Fig. 1.
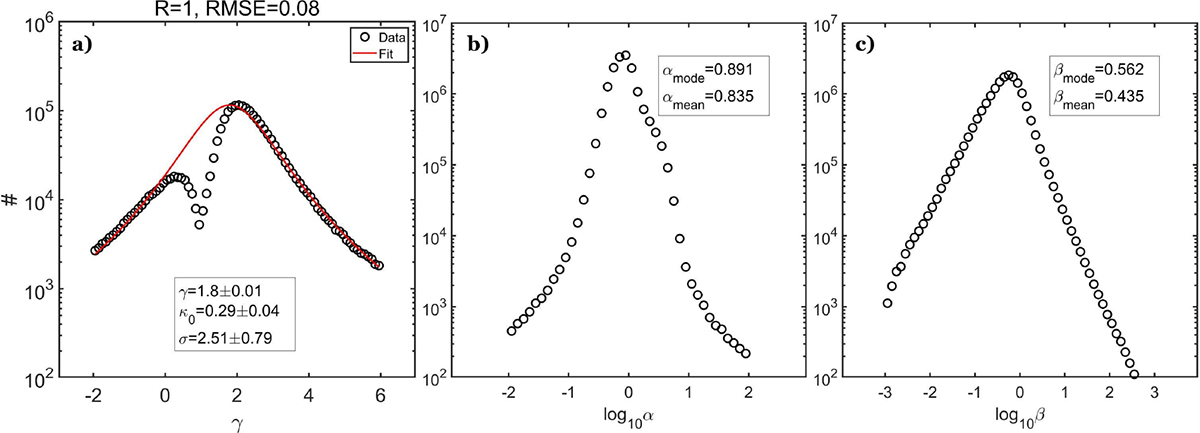
Download original image
Histograms and distributions for the entire Wind dataset spanning the 1995–2023 time period: (a) histogram of γ and best-fit κ-Gaussian distribution (solid red line), (b) histogram of anisotropy, and (c) histogram of plasma β.
Current usage metrics show cumulative count of Article Views (full-text article views including HTML views, PDF and ePub downloads, according to the available data) and Abstracts Views on Vision4Press platform.
Data correspond to usage on the plateform after 2015. The current usage metrics is available 48-96 hours after online publication and is updated daily on week days.
Initial download of the metrics may take a while.