| Issue |
A&A
Volume 691, November 2024
|
|
|---|---|---|
| Article Number | A307 | |
| Number of page(s) | 12 | |
| Section | Extragalactic astronomy | |
| DOI | https://doi.org/10.1051/0004-6361/202452113 | |
| Published online | 21 November 2024 | |
Compact ellipticals in the Antlia cluster of galaxies
1
Facultad de Ciencias Astronómicas y Geofísicas de la Universidad Nacional de La Plata, and Instituto de Astrofísica de La Plata (CCT La Plata – CONICET, UNLP), Paseo del Bosque S/N, B1900FWA La Plata, Argentina
2
Consejo Nacional de Investigaciones Científicas y Técnicas, Godoy Cruz 2290, C1425FQB Ciudad Autónoma de Buenos Aires, Argentina
3
Instituto de Astronomía Teórica y Experimental (CCT Córdoba – CONICET, UNC) and Observatorio Astronómico de Córdoba, Universidad Nacional de Córdoba, Laprida 854, X5000BGR Córdoba, Argentina
4
Departamento de Astronomía, Universidad de Concepción, Concepción, Chile
⋆ Corresponding author; jpcaso@fcaglp.unlp.edu.ar
Received:
4
September
2024
Accepted:
7
October
2024
Context. Compact ellipticals (cEs) are rare objects in the local Universe, but relevant for the evolution of galaxies. Their origin is not completely understood, with evidence equally suggesting that they are relics of early epochs, and remnants of tidal disruptions.
Aims. This article aims to characterise two cEs, members of the nearby Antlia cluster, providing insights into the formation channels of cEs residing in high-density environments.
Methods. This dataset consists of archival ACS/HST images and Gemini/GMOS slit spectra. The isophotal analysis of the cEs was compared with their kinematics and stellar population synthesis. The results were also compared with a sample of cEs and ‘relic’ galaxies from the literature, to put them into context.
Results. Their characterisations highlight clear differences between the two cEs. Although the stellar populations for both cEs are mainly old, with mass-weighted ages above 10 Gyr, FS90 110, the most massive one, has a minor contribution from an intermediate-age population. Besides, it presents rotational evidence, a remarkably bright nucleus for its luminosity, and a clear dichotomy between the inner and outer components. It is probably the remnant of a low-mass disc galaxy that has been tidally disrupted by the close massive elliptical NGC 3258. On the contrary, FS90 192 does not present evidence for either rotation or discy isophotes, and its population synthesis leads to a stellar population with ages above 12 Gyr. It is probably a low-mass analogue to ‘relic’ galaxies.
Key words: galaxies: elliptical and lenticular / cD / galaxies: evolution / galaxies: clusters: individual: Antlia
© The Authors 2024
 Open Access article, published by EDP Sciences, under the terms of the Creative Commons Attribution License (https://creativecommons.org/licenses/by/4.0), which permits unrestricted use, distribution, and reproduction in any medium, provided the original work is properly cited.
This article is published in open access under the Subscribe to Open model. Subscribe to A&A to support open access publication.
1. Introduction
In the current scenario, early-type galaxies (ETGs) have evolved in two phases. At high redshift, a star-forming object evolves and eventually consumes its gas content in a dissipative phase. Subsequently, these ETGs grow through mergers, mainly minor ones, that barely increase the stellar mass of the galaxy but have a significant effect on its size. This is supported by studies claiming that, at fixed stellar mass, the ETGs at z > 1 have noticeable lower half-light radii than their local counterparts (e.g. Daddi et al. 2005; Trujillo et al. 2007; van Dokkum et al. 2010), but also by indirect indicators, such as the radial gradients of the colours in globular cluster (GC) systems (GCSs, e.g. Forbes et al. 2011; Caso et al. 2017; Wu et al. 2022). These compact spheroids might also evolve as the bulges of disc galaxies at z = 0 (Graham et al. 2015; Costantin et al. 2021; Gao et al. 2022) and, less frequently, remain relatively undisturbed as relic galaxies in the local Universe (Trujillo et al. 2014; Beasley et al. 2018).
This second phase is particularly efficient in dense environments, as has been suggested by the environmental dependence of the luminosity function in ellipticals (Tempel et al. 2011). Although recent observations of galaxies at z ≈ 16 have led to some tension with ΛCDM predictions (e.g. Furtak et al. 2023), it is usually assumed that the hierarchical formation leads to the build-up of massive haloes via mergers (e.g. Frenk & White 2012), where the remaining satellite haloes lose mass through successive passages at the pericentre (Rhee et al. 2017; van den Bosch et al. 2018; Drakos et al. 2020), and even the gas supply of the galaxy hosted by them (Darvish et al. 2016; Cora et al. 2019). Depending on the orbital parameters of the satellite galaxy, it can be stripped of part of its stellar population, leaving the central regions relatively unaffected, as was proposed initially by Faber (1973). From this scenario, the original galaxy becomes an ultra-compact dwarf (UCD) in the case of nucleated dwarf galaxies (Bassino et al. 1994; Bekki et al. 2003; Mayes et al. 2021), or a compact elliptical (cE) in the case of more massive galaxies (Bekki et al. 2001; Martinović & Micic 2017).
The galaxy M 32, a satellite of Andromeda, is a paradigmatic case of this scenario. It shows an extended star formation history, spanning several 109 years (Gyr, Coelho et al. 2009; Monachesi et al. 2012), and a stripping origin from a relatively massive progenitor (D’Souza & Bell 2018). The presence of tidal streams in some cEs (e.g. Huxor et al. 2011) supports this scenario, as well as the higher-than-expected metallicity of cEs in dense environments (e.g. Chilingarian et al. 2007; Price et al. 2009). However, the existence of isolated cEs (Huxor et al. 2013; Paudel et al. 2014) suggests a variety of formation channels, including a connection with relic galaxies, as the natural extension of giant ellipticals towards lower masses (e.g. Kormendy & Bender 2012, and references therein).
The Antlia galaxy cluster is located in the southern sky, at a distance of ≈35 Mpc (Dirsch et al. 2003), making it one of the nearest galaxy clusters, besides Virgo and Fornax. The first photometrical surveys of the galaxy population in Antlia were conducted by Hopp & Materne (1985) and Ferguson & Sandage (1990), but no further studies were carried out until Smith Castelli et al. (2008a), which was later extended to adjacent regions by Calderón et al. (2015, 2018, 2020), resulting in a total sample of approximately 300 galaxies. The galaxy cluster is dynamically young, containing two subgroups dominated by the giant ellipticals (gEs) NGC 3258 and NGC 3268. These galaxies possess GCSs with thousands of members (Bassino et al. 2008; Caso et al. 2017, and references therein), suggesting a rich history of mergers. The gE NGC 3268 is centred on an extended X-ray emission, which is elongated towards the NGC 3258 subgroup (Nakazawa et al. 2000; Wong et al. 2016). Interpretations about the membership of different substructures in the literature differ (Caso & Richtler 2015; Hess et al. 2015), as well as estimations of its total mass, which ranges from several times 1013 M⊙ to a few times 1014 M⊙ (Hess et al. 2015; Wong et al. 2016). Although distances from surface brightness fluctuations (SBFs) place NGC 3258 in the foreground of NGC 3268 (D = 32.5 Mpc and 35.3 Mpc, respectively, Tully et al. 2013), the difference does not exceed the usual errors in distances, which are about 10%.
As a follow-up to the photometric survey, Smith Castelli et al. (2008b) analysed the properties of two cE candidates, which were spectroscopically confirmed as members of the Antlia cluster in Smith Castelli et al. (2012). These cEs are referred to as FS90 110, located at 0.77 arcmin from NGC 3258 in projection (approximately 7 kpc at the assumed distance) and FS90 192, located at 1.35 arcmin from NGC 3268 (approximately 14 kpc).
In this study, we deepen the photometric analysis of these two cEs, besides the synthesis of the stellar populations and some kinematical insight in the case of FS90 110, to disentangle the most probable formation channel for each cE. The paper is organised as follows: Sect. 2 describes the observations and data reduction, in Sect. 3 we present the results, and Sect. 4 is devoted to the discussion of them in the context of the literature. Finally, in Sect. 5 our conclusions are summarised.
2. Observations and additional data
2.1. Photometric data
The photometric dataset consists of two fields observed with the ACS Wide Field Camera, mounted on the Hubble Space Telescope. These fields are centred on the gEs NGC 3258 and NGC 3268 and include the cEs FS90 110 and FS90 192. These images are publicly available at the Mikulski Archive for Space Telescopes (MAST, programme 9427, PI: W. E. Harris). They result from the addition of four 1340 s exposures in the F435 filter and four 570 s exposures in the F814 filter. The images have a pixel scale of 0.05 arcsec/pixel and a field of view (FoV) of 202 × 202 arcsec2.
The surface brightness profiles of NGC 3258 and NGC 3268 were measured using the task ELLIPSE. Synthetic models of these galaxies were generated with BMODEL (both IRAF tasks) and subtracted from the original images. Subsequently, the brightness profiles of the cEs were measured from these modified images. For FS90 110, it was necessary to fix the centres of the isophotes due to a low surface brightness structure towards NGC 3258, which distorts the outer isophotes of the galaxy. This distortion has already been noted by Smith Castelli et al. (2008b), who detected this ‘bridge’ in several filters. The surface brightness measurements were calibrated in the B and I filters using the zero points from Sirianni et al. (2005), which are ZP435 = 25.779 mag and ZP814 = 25.501 mag. Finally, we applied the Galactic extinction corrections obtained from NED, E(B − V) = 0.07 mag for FS90 110 and E(B − V) = 0.079 mag for FS90 192, following Schlafly & Finkbeiner (2011).
A search for GC candidates was also carried out, following the same procedure as Caso et al. (2013, 2014) for these images, and Caso et al. (2019) for other nearby galaxies with available ACS photometry. However, no over-density of GC candidates was found around both cEs.
2.2. Spectroscopic data
There are GEMINI–GMOS slit spectra available for both cEs in the Gemini Science Archive (indicated in the lower panels of Fig. 1), as part of multi-object masks designed to study the galaxy and GC populations around both gEs (programmes GS-2009A-Q-25 and GS-2011A-Q-35). Both slits are centred on the cEs and have lengths of approximately 20 arcsec, spanning up to approximately five times the effective radius of the galaxies (see Sect. 3.1). The position angle (PA) for the slit centred on FS90 110 is 44 degrees, and 73 degrees for that corresponding to FS90 192. The grating B600_G5303 blazed at 5000 Å was used, applying small shifts in the central wavelengths to fill the CCD gaps. The slit width is 1 arcsec, and the resulting full width at half maximum (FWHM) is 4.6 Å. The wavelength coverage for both slits spans ≈ 4000 − 7200 Å. The total exposure times are 3.3 h for programme GS-2009A-Q-25 (corresponding to FS90 110) and 3.5 h for programme GS-2011A-Q-35 (FS90 192), and the seeing ranges from 0.6 − 0.7 arcsec. Each science exposure was observed together with individual calibration flats and CuAr arc spectra to correct for small variations due to telescope flexion. Flux standard stars were observed on the same nights as the science exposures, and with identical instrumental configuration, to obtain proper flux calibration. We refer the reader to Smith Castelli et al. (2012), who presented these data for the first time, for further information about the observations. Data reduction was performed using the GEMINI.GMOS package within IRAF in the usual manner.
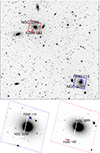 |
Fig. 1. Central region of the Antlia cluster of galaxies. Upper panel: DSS image in the R filter of a region containing the gEs NGC 3258 and NGC 3268, with a FoV of 30 × 30 arcmin2. The FoVs of the two ACS fields are marked with red and blue polygons. Both cEs analysed in this article, FS90 110 and FS90 192, are highlighted with circles. Lower panels: F814W images for the two ACS fields, including the Gemini-GMOS slits used for the spectroscopic analysis. The three images follow the usual orientation: north is up and east to the left. |
3. Results
3.1. Surface brightness profiles
The surface brightness profiles in filters B (blue circles) and I (red squares) are presented in the upper panels of Fig. 2 for FS90 110 and Fig. 3 for FS90 192. In both figures, the profiles have been corrected for Galactic extinction and plotted as a function of the equivalent radius in arcsec, req ( ). In the upper left panels of Figs. 2 and 3, they are fitted by single Sérsic models (Sersic 1968), described by the following equation:
![$$ \begin{aligned} \mu ({r_{\rm eq}}) = \mu _{\rm eff} + 1.0857*{b_n}\left[ \left( \frac{{r_{\rm eq}}}{r_{\rm eff,gal}} \right)^{\frac{1}{n}}-1 \right] ,\end{aligned} $$](/articles/aa/full_html/2024/11/aa52113-24/aa52113-24-eq2.gif)
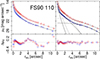 |
Fig. 2. Analysis of the surface brightness profiles for FS90 110. Left panels: upper panel presents the surface brightness profiles for FS90 110 in the B (blue circles) and I (red squares) filters. The solid and dashed curves represent the fit of single Sérsic laws. The lower panel illustrates the residuals from these fits for each filter. Right panels: surface brightness profiles for FS90 110 are fitted with three different components, each represented by a Sérsic law. The thin curves depict the individual components, while the thick ones represent their sum. The lower panel displays the residuals from the three-component fit for each filter. |
with req and reff, gal (galactic effective radius) measured in arcsec, and μ(req) and μeff in mag arcsec−2. We obtained bn from the expression in Ciotti (1991), and n is the Sérsic shape index. Solid and dashed curves indicate the fits for the B and I filters, respectively, and their parameters are listed in Table 1. According to the SBF distances stated in Sect. 1, 1 arcsec corresponds to 158 pc in the case of FS90 110, and 171 pc for FS90 192. For both cEs, the residuals in the lower left panels suggest the existence of more than one component.
Parameters of the Sérsic law fits on the surface brightness profiles for both cEs.
In the case of FS90 110, this was already noted by Smith Castelli et al. (2008b), who assumed two components for the surface brightness profile in the R filter from ground-based observations. That fit resulted in positive residuals for the inner 2 arcsec, indicating the presence of a nuclear component. Similar results emerge for two components in the present study; hence, three components are assumed. The resulting profile is plotted in the upper right panel of Fig. 2. The individual components are shown with thin curves and their sum with thick ones. The residuals, displayed in the lower right panel, are better than those from the single component fit. The parameters for the Sérsic fits are listed in Table 1, along with their total apparent magnitudes. The two extended components resemble those fitted by Smith Castelli et al. (2008b), with effective radii of reff, in = 1.43 and reff, out = 5.26 arcsec, both presenting an index of n < 1. The nuclear component in Table 1 has reff, nuc < 0.3 arcsec, an index of n ≈ 1.4, and (B − I)0 = 2.35 mag. It dominates the surface brightness profile only for the inner arcsec. The so-called ‘inner component’ governs the profile from req = 1 to req = 4 arcsec, and its index, n ≈ 0.85, does not significantly differ from an exponential profile usually used to represent discs. The outer component fits the halo of the cE, presenting n ≈ 0.5.
Although the presence of a halo is not evident in the surface brightness profile of FS90 192, two Sérsic components lead to persistent residuals in our analysis. Assuming three components produces a nuclear component, with reff, nuc < 0.3 arcsec and an index of n ≈ 1.85, which rules the surface brightness profile for the inner arcsec and has (B − I)0 = 2.55 mag. For larger galactocentric radii, the profile is governed by the outermost component, with reff, out ≈ 1.8 arcsec and n ≈ 2. The so-called inner component has n < 0.5 and does not dominate at any radius, but its existence is reflected in the surface brightness profiles from req = 1 to req = 3 arcsec.
Considering the distances for their corresponding gEs (i.e. NGC 3258 for FS90 110 and NGC 3268 for FS90 192) from Tully et al. (2013), the absolute magnitudes in the I filter for the nuclear components of FS90 110 and FS90 192 are MI, nuc = −16.63 mag and MI, nuc = −14.08 mag, respectively. For the entire galaxy, the absolute magnitudes are MI = −18.11 mag for FS90 110 and MI = −16.93 mag for FS90 192. Based on these distances, the effective radii for the nuclear components of FS90 110 and FS90 192 are 43 ± 4 pc and 48 ± 6 pc, respectively. These are consistent with the size–luminosity relation for the nuclei of dwarf ellipticals and spirals in Fig. 8 from den Brok et al. (2014).
The parameters obtained from the fitting of elliptical isophotes using ELLIPSE (see Sect. 2.1) are shown in Fig. 4 for FS90 110 (left panels) and FS90 192 (right panels). The top panels display the (B − I)0 colour profiles as a function of req, and present negative gradients in both cases, with bluer colours towards larger galactocentric distances. Following the expression from Li et al. (2011), these gradients are Δ(B − I)0 ≈ 0.25 for FS90 110 in the radial regime from req = 0.2 to 8 arcsec, and Δ(B − I)0 ≈ 0.2 for FS90 192, from req = 0.2 to 6 arcsec. In the case of FS90 110, the gradient varies with galactocentric distance. The (B − I)0 profile remains nearly constant in the radial range from 1 to ≈6 arcsec, and it gets bluer at larger radii, in agreement with the galactocentric distance at which the outer component dominates the surface brightness profile, to the detriment of the inner one. For FS90 192, the colour profile also changes on the outskirts, settling at (B − I)0 ≈ 1.9 mag beyond ≈5 arcsec.
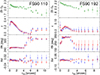 |
Fig. 4. Parameters from the isophotes fit to the surface brightness profiles for both cEs. Left panels: The parameters for FS90 110 are depicted with blue circles and red squares for the B and I filters, respectively. From top to bottom, the panels show the profiles for the colour (B − i)0, the ellipticity (ϵ), the PA, and the parameter A4 from the harmonic expansion, as a function of req. Right panels: Equivalent profiles for FS90 192. |
Moving downwards, the ellipticity (ϵ) profiles are displayed for the B filter (blue circles) and the I filter (red squares). In the case of FS90 110, ϵ reaches its maximum at req ≈ 0.5 arcsec, then decreases to nearly zero around req ≈ 4 arcsec. The progressive decrease in ϵ occurs in the same radial regime dominated by the inner component, after which the outer one rules the surface brightness profile. This transition is also reflected in the PA profile, shown in the third-row panels. Here, the isophotes from both filters maintain a PA of ≈80 deg up to req ≈ 4 arcsec, after which it increases to 160 deg at req ≈ 6 arcsec. The lower panels display the A4 parameter as a function of req. This is one of the fourth-order coefficients of the Fourier expansion for the isophotes, and non-zero values correspond to deviations from the elliptical shape (e.g. Ferrarese et al. 2006; Bassino & Caso 2017). Potential variations in the A4 parameter are observed, with values close to zero up to req ≈ 4 arcsec, followed by predominantly negative values (indicating boxy isophotes) at larger galactocentric radii, albeit with some noise in the results.
For FS90 192, the change in ϵ is relatively small, remaining below 0.05 at all radii. In both filters, it peaks at req ≈ 1.5 arcsec before declining to nearly zero beyond req ≈ 3 − 3.5 arcsec. The PA remains approximately constant at ≈150 deg from req = 0.5 to ≈2.5 arcsec, after which it decreases. These behaviours agree with the presence of three components in the surface brightness profile, with the so-called inner component influencing the parameters from 1 to ≈4 arcsec. Measurement of the PA becomes challenging when ϵ ≈ 0, and hence the results are fixed beyond req = 3.5 arcsec. Finally, the A4 parameter shows no significant deviation from zero at any radius.
The stellar masses, M⋆, of the cEs were estimated through the single Sérsic profiles fitted to the I filter, which are numerically integrated with steps of 1 arcsec and expressed in terms of solar luminosities, based on the values derived by Willmer (2018). For each step, the luminosities were converted to M⋆ based on the colour profiles depicted in Fig. 4, and the mass-to-light ratios for the I filter (M/LI), derived for single stellar populations (SSPs) by the MILES collaboration1 (Vazdekis et al. 2012; Ricciardelli et al. 2012), assuming an initial mass function (IMF) from Chabrier (2003), ages in the range from 9 to 13 Gyr, and metallicities of [M/H] > −0.5 dex. These criteria agree with the luminosity weighted ages derived in Sect. 3.3, and lead to M/LI between 1.5 and 3.25 M⊙/L⊙. The upper limit for the integration is 5 rreff in the case of FS90 192, but it increases to 7 rreff for FS90 110 to take into account its extended stellar halo. Hence, the M⋆ of FS90 110 and FS90 192 are estimated to be 2.1 × 10⁹ and 6.1 × 10⁸ M⊙, respectively.
Figure 5 displays reff in kiloparsecs plotted against M⋆ in units of 109 M⊙. The grey circles correspond to the ETGs listed in the photometric catalogue of the Antlia cluster from Calderón et al. (2020), excluding those objects spectroscopically confirmed as background galaxies. The estimation of M⋆ is based on the T1 magnitudes and (C − T1) colours of the galaxies, both from Calderón et al. (2020), and the M/LT1 derived from the PARSEC-COLIBRI SSPs (Bressan et al. 2012; Marigo et al. 2017) by the CMD service V 3.72. The filled circles highlight galaxies presenting velocities in the line of sight (vLOS) that agree with the recessional velocity of the Antlia cluster. The cEs FS90 110 and FS90 192 are highlighted with a diamond and a pentagon, respectively, and their positions deviate from those of Antlia ETGs with similar M⋆. Squares and triangles denote cEs from the literature (Chilingarian et al. 2009; Ferré-Mateu et al. 2018; Grèbol-Tomàs et al. 2023), spanning two orders of magnitude in M⋆. The cEs constitute a mass-size relation shifted to lower values of reff in comparison to normal ETGs. The star symbols denote massive compact galaxies in the local Universe from Ferré-Mateu et al. (2017), and in the range of 0.1 < z < 0.4 from the INSPIRE project (Spiniello et al. 2024), and the filled ones differentiate those classified as relic galaxies. These latter objects might be considered as the massive end of cEs in the scenario of secular evolution.
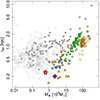 |
Fig. 5. Effective radius (reff) plotted against M⋆ on a logarithmic scale for ETGs listed by Calderón et al. (2020) in the photometric catalogue of the Antlia cluster, including candidates (open circles) and spectroscopically confirmed members (filled circles), with the cEs FS90 110 and FS90 192 represented by a diamond and a pentagon, respectively. A sample of cEs from the literature is depicted with green squares (Grèbol-Tomàs et al. 2023), orange triangles (Ferré-Mateu et al. 2018), and upside-down blue triangles (Chilingarian et al. 2009). Open (filled) stars denote massive compact galaxies (relics) from Ferré-Mateu et al. (2017) and Spiniello et al. (2024). |
3.2. Kinematics from the spectra
The two-dimensional spectra for both cEs are split into radial ranges, achieving a signal-to-noise ratio (S/N) of approximately 7–8 at 5000 Å. From these, we measured the heliocentric vLOS, applying the FXCOR package within IRAF for the wavelength range of 4800 − 6000 Å. The models of SSPs from MILES (Vazdekis et al. 2010) for old populations (10 and 12 Gyr) and solar metallicities were employed as templates. For FS90 110, the orientation of the slit deviates by 30 deg from the PA profile in the radial regime from 0 to 4 arcsec, corresponding to the isophotes with larger ellipticities. The left panel of Fig. 6 illustrates its distribution of heliocentric vLOS as a function of the galactocentric distance, obtained for the slit orientation, which are also listed in Table 2. The central arcsec exhibits a constant velocity, although we are aware that these measurements could be affected by the seeing of the observations. Beyond 1 arcsec, there are signs of rotation, with ΔvLOS ≈ 25 − 30 kms−1.
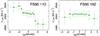 |
Fig. 6. Distribution of heliocentric vLOS measured by means of FXCOR, as a function of the galactocentric distance, for both cEs. |
Measurements of vLOS as a function of the galactocentric distance for both cEs.
In the case of FS90 192, there is no evidence of rotation, which is consistent with the extremely low ellipticity of the isophotes. However, the orientation of the slit is nearly perpendicular to the PA in the corresponding radial range, suggesting that additional observations are needed to confirm this result.
With the aim of measuring velocity dispersions, the two-dimensional spectra were spatially rebinned to achieve a S/N ≳ 20 at 5000 Å. For both cEs, spectra spanning up to 1 arcsec were extracted to represent the nuclear component. Additionally, two other spectra were extracted on both sides of the nuclear region, covering the galactocentric range of 1 − 4 arcsec. These roughly represent the inner component in the case of FS90 110, and the contribution of the inner and outer components for FS90 192. The velocity dispersion in the line of sight (σLOS) was measured by means of the penalised pixel fitting code (pPXF, Cappellari & Emsellem 2004; Cappellari 2017) in the wavelength range of 4800 − 6000 Å, which contains several absorption features typical of the spectra in ETGs (Hβ, Mgb, and Fe lines). The E-MILES single stellar population models (Vazdekis et al. 2016), included in the pPXF libraries, were chosen as templates. The expected σLOS for both cEs is close to the instrumental dispersion, and the convolution of the templates was performed through Fourier transform to achieve accurate measurements, as is described by Cappellari (2017). For FS90 110, the fit to the nuclear component results in σLOS = 139 ± 8 km s−1, with h3 and h4 parameters that do not differ from zero. The fit to the spectra on both sides leads to vLOS = 2928 ± 5 km s−1 and σLOS = 126 ± 9 km s−1 for the region to the north-east of the nuclear region (corresponding to the negative rgal ranges in Table 2) and to vLOS = 2886 ± 5 km s−1 and σLOS = 124 ± 10 km s−1 for the region to the south-west (positive rgal ranges in Table 2). For FS90 192, the fit to the nuclear region corresponds to σLOS = 54 ± 7 km s−1, and the fit to the addition of the spectra on both sides (to increase the S/N) leads to σLOS = 52 ± 9 km s−1.
From these, we can constrain the dynamical mass (Mdyn) of the cEs, on the basis that they are pressure-supported. Although signs of rotation are found in FS90 110, this is a fair assumption, considering that the rotational velocity, Δvrot ≈ 30 km s−1, is a fifth of its velocity dispersion up to 4 arcsec (≈3 reff). Then, following the expression from Wolf et al. (2010),
with G being the gravitational constant, and k depending on the Sérsic index of the surface brightness profile, in these cases assumed as k = 4.7 from the values listed in Appendix B from that article. Then, Mdyn = (4.3 ± 0.6)×109 M⊙, which is twice the M⋆ derived in Sect. 2.1. On the other hand, we obtain for FS90 192 Mdyn = (8 ± 2)×108 M⊙, which is similar to its M⋆. We shall return to this issue later on.
Figure 7 displays σLOS as a function of M⋆ in units of 109 M⊙ for FS90 110 and FS90 192, represented by a large diamond and pentagon, respectively. Triangles and squares correspond to cEs from Chilingarian et al. (2009), Ferré-Mateu et al. (2018), and Grèbol-Tomàs et al. (2023), following the same symbol coding as Fig. 5. The stars depict massive compact galaxies from Ferré-Mateu et al. (2017) and Spiniello et al. (2024), with filled ones highlighting those labelled as ‘relic’ galaxies. FS90 110 exhibits a σLOS value above the upper limit of the expected range for its M⋆, while σLOS for FS90 192 is within the range of cEs with masses of about 1 − 2 × 10⁹ M⊙. The solid lines represent the two power laws fitted by Zahid et al. (2016) to ‘normal’ ETGs. The framed symbols distinguish those cEs with ages above 10 Gyr. They tend to present larger values of σLOS than normal ETGs, in agreement with relic galaxies for larger masses. Following Zahid et al. (2016), we fitted the expression
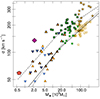 |
Fig. 7. Velocity dispersion (σLOS) plotted against M⋆ for FS90 110 (large diamond) and FS90 192 (large pentagon), alongside a sample of cEs and massive compact galaxies from the literature. The symbol coding follows that of Fig. 5, and the framed symbols depict cEs with mean ages above 10 Gyr. The solid lines represent the scaling relation for quiescent galaxies from Zahid et al. (2016). The dashed lines show the function fitted to these cEs, while the dotted ones correspond to cEs younger than 10 Gyr. |
with M′ representing the ratio between M⋆ and 1010.26 M⊙. The fitted parameters are σb = 182 ± 11 km s−1, α1 = 0.43 ± 0.08, and α2 = 0.22 ± 0.07, and the dashed curve represents the relation in the figure. The expression is also fitted to the cEs younger than 10 Gyr, leading to σb = 132 ± 13 km s−1, α1 = 0.47 ± 0.11, and α2 = 0.30 ± 0.10. The dotted lines in Fig. 7 correspond to this latter relation and it does not differ significantly from that obtained for normal ETGs by Zahid et al. (2016).
3.3. Stellar population synthesis
The analysis of stellar populations was performed through the synthesis code STARLIGHT (Cid Fernandes et al. 2005). The algorithm combines spectra from a base of SSP spectra and searches for the best linear combination that matches the observed spectrum, to obtain the modelled spectrum, Sλ, as follows:
![$$ \begin{aligned} S_\lambda = S_{\lambda _0} \left[\sum _{j=1}^{N_\star } x_j b_{j,\lambda } r_\lambda \right] \otimes G(v_{\rm LOS},\sigma _{\rm LOS}), \end{aligned} $$](/articles/aa/full_html/2024/11/aa52113-24/aa52113-24-eq5.gif)
where Sλ0 is the modelled flux at the normalisation wavelength, λ0, N⋆ is the number of components in the base of SSPs, xj are the relative contributions of each SSP, bj, λ ≡ Lj(λ)/Lj(λ0) is the spectrum of the jth SSP normalised at λ0, rλ = 10−0.4(Aλ − Aλ0) is the reddening term, Aλ is the extinction law (Cardelli et al. 1989), and G(vLOS, σLOS) is a Gaussian centred in velocity, vLOS, with a velocity dispersion, σLOS. This latter term accounts for a possible shift and broadening of the spectrum, which is more important when dealing with pressure-supported systems (e.g. galaxies’ bulges). The best model is found according to minimisation:
![$$ \begin{aligned} \chi ^2 \equiv \sum _{\lambda _i}^{\lambda _f} [O(\lambda ) - S(\lambda _i]^2 \cdot \omega (\lambda _i)^2, \end{aligned} $$](/articles/aa/full_html/2024/11/aa52113-24/aa52113-24-eq6.gif)
where O(λ) is the observed spectrum, ω(λ) is a weight term (a zero value is used for masking anomalous pixels and emission lines), and λi and λf are the initial and final wavelengths to fit, respectively. It is worth mentioning that, unlike other codes designed for population synthesis, STARLIGHT considers the line strengths and the spectrum continuum to fit the SSP combination that best represents the observation.
For the base, we chose the SSPs from the semi-empirical MILES library (Vazdekis et al. 2010), which are publicly available3. We considered different sets of evolutionary tracks from BaSTI isochrones, considering different ages and metallicities, with [α/Fe] = 0 and 0.4 dex, and the IMF from Chabrier (2003). In particular, we selected models with ages ranging from 1 to 15 Gyr and [Z/H] −0.7, −0.4, −0.3, 0, 0.08, 0.17, and 0.3 dex, totalling 231 SSPs. In all cases, the spectral range fitted was 4400 − 6700 Å to avoid some calibration issues at the blue end of the spectra, which is typically noisier. To achieve S/N > 50, which is desirable for accurate population fittings, the spectra for each cE were extracted in two radial regimes. The first regime considered the inner arcsec, and it is labelled as the ‘nuclear component’. The second regime, labelled as the ‘inner component’ (to follow the description from Sect. 3.1), was obtained by adding the extractions from each side of the nucleus. We are aware that these radial distinctions are not equivalent to the deconstruction in components that comes from the analysis in Sect. 2.1, and that the labels only represent which component produces the larger contribution to the surface brightness profile. We also modelled the sum of the spectroscopic extractions for each cE, hereafter referred to as the ‘entire spectrum’.
Table 3 shows the mean ages and metallicities obtained from the spectral fits to the six spectra (nuclear and inner components, as well as the entire spectra, for both cEs), applying the sets of templates with [α/Fe] = 0 and 0.4 dex. The errors are based on 100 Monte Carlo realisations. In general, the fits describe the spectra well, presenting reduced-χ2 values close to 1, with no significant difference based on the [α/Fe]. The set corresponding to [α/Fe] = 0.4 dex leads to slightly higher ages, although all of them correspond to old stellar populations, and hence mass-weighted means result in older populations than luminosity-weighted ones.
Results from the spectral synthesis of the two cEs by means of the code STARLIGHT.
The σLOS for FS90 110, calculated from the line broadening, is in the range of 150 − 170 km s−1, slightly larger than measurements from PPXF, although we have to warn that the wavelength range used in this fit differs from that in Sect. 3.2. In the case of FS90 192, the measurement of σLOS is limited by the dispersion from the instrumental FWHM. The upper panels in Fig. 8 display the fits for the nuclear component of both cEs, for the set of templates with [α/Fe] = 0.4 dex. The large panels show the observed spectrum in blue and the modelled one through the fit of SSPs in red, with the residuals in green. The small panels to the right of each spectrum correspond to the age-metallicity distribution of the fitted SSPs, with the size of the circles representing the contribution that each SSP has in the luminosity-weighted (upper panel) and mass-weighted (lower panel) calculations. The nuclear component for each cE is fitted by SSPs with ages above 12 Gyr, results that are also reproduced when solar abundances of [α/Fe] are assumed. These suggest that star formation occurred in a short period, which agrees with supra-solar [α/Fe] enhancement.
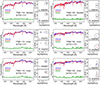 |
Fig. 8. Results from the full spectral fitting to the spectra of the cEs, by means of the code STARLIGHT, scaled to the flux at 4750 Å. Each three-panel plot corresponds to a particular spectrum and set of templates, considering two different [α/Fe] enhancements (see the text for further details). The blue curve represents the observed spectrum and the modelled one is displayed in red, with the residuals in green. The small panels to the right of each spectrum correspond to the age–metallicity distribution of the fitted SSPs, with the size of the circles representing the contribution that each SSP has in the luminosity-weighted (upper panel) and mass-weighted (lower panel) calculus. The crosses correspond to the weighted means for each case. |
The left panels in the second and third rows of Fig. 8 display the fit to the inner component of FS90 110 for both sets of stellar populations. The design of the panels and the symbol coding are analogous to those in the upper row. For [α/Fe] = 0 (second row), there is a contribution of approximately 40% from stellar populations with ages of 1.5 − 2 Gyr when weighted by luminosity, but this decreases to approximately 10% when contributions are mass-weighted. The set of templates with supra-solar enhancement (third row) still prefers a more restricted period for the star formation history, albeit spanning several gigayears, with a contribution of approximately 24% from populations with ages of approximately 7 Gyr when weighted by luminosity, and approximately 13% when mass-weighted. However, we are aware that one of them presents [Z/H] = −0.7 dex, which significantly differs from the supra-solar metallicities of the rest of the populations and contradicts the progressive enrichment of the interstellar medium. These results suggest that a wide star formation history, leading to [α/Fe] ≈ 0 dex, is more physically motivated. The changes in the mean ages and metallicities listed in Table 3 between the nuclear and inner components agree with the colour gradient of FS90 110 up to req ≈ 6 arcsec, Δ(B − I)0 ≈ 0.1 mag (see Fig. 4). Specifically, the luminosity-weighted metallicity for the nuclear component, assuming an enhancement of [α/Fe] = 0.4 dex, does not differ from that for the inner component using both sets of templates, but the latter are younger by approximately 2 − 4 Gyr. Although some minor contribution from intermediate-age populations is found in FS90 110, the population synthesis for the entire spectrum using the two sets of templates does not significantly differ when weighted by mass. It is also possible to calculate the M/LI for FS90 110 from these ages and metallicities, and those derived by the MILES collaboration for their SSP models (see Table 4). It is worth comparing this value with the M/LI obtained from the dynamical masses in Sect. 3.2, also listed in the table. To calculate the latter, the luminosity in the I filter comes from the numerical integration of the Sérsic profile (see Sect. 2.1), assuming the distance previously stated for FS90 110, besides the Sun magnitude from Willmer (2018). The (M/LI)dyn doubles that expected for the fitted stellar populations.
Mass-to-light rations derived for both cEs.
The right panels in the second and third rows of Fig. 8 present the fit to the spectrum spanning the galactocentric range of 1 − 4 arcsec of FS90 192, which corresponds to the addition of the fluxes from the inner and outer components, according to the photometric analysis. The fits from both sets of templates are governed by SSPs with ages above 12 Gyr, although there are intermediate-age populations (≈1 − 2 Gyr) making minor contributions, in the range of 1% when they are weighted by mass. If [α/Fe] = 0.4 dex is adopted, a wide range of metallicities is combined to represent the spectrum. The luminosity-weighted change in the mean metallicity between this spectrum and that corresponding to the nuclear component agrees with the colour gradient from Fig. 4. The stellar population synthesis for both spectra suggests that the star formation occurred rapidly, and the mean ages and metallicities fitted to the entire spectra, considering [α/Fe] = 0.4 dex, are used to represent it. For FS90 192, the luminosity in the I filter was obtained in the same manner as the one of FS90 110, and the (M/LI) derived from it and Mdyn is consistent with what is expected for its stellar populations (see Table 4).
The left panel of Fig. 9 displays the mass–metallicity relation for a sample of cEs and compact massive galaxies, including the values derived in the mass-weighted case for FS90 110 (diamond) and FS90 192 (pentagon) from the entire spectrum. In both cases, the values obtained through the set with [α/Fe] = 0.4 dex are assumed. The symbols follow the same colour coding as the previous figures. The metallicities from Chilingarian et al. (2009), expressed in terms of [Fe/H], were converted to [M/H] following the expression from Salaris et al. (1993), with the parameters from Yi et al. (2001). We lack [α/Fe] enhancements for these cEs, so we have assumed the median from the sample listed in Ferré-Mateu et al. (2018), which is ≈0.1. The solid line shows the extrapolation of the mass–metallicity relation for massive ETGs from the ATLAS survey (McDermid et al. 2015), with dotted ones representing its dispersion. The dashed curve corresponds to the relation fitted to ETGs from the Fornax cluster by Romero-Gómez et al. (2023). Both cEs exhibit a larger metal content than ETGs with similar M⋆, as most cEs and massive compact galaxies in the sample. The right panel shows the metallicity versus the age for the same galaxy sample. Those cEs with ages above 10 Gyr mainly have supra-solar metallicities, including many with similar M⋆ to FS90 110. However, several objects from Chilingarian et al. (2009) present old populations and sub-solar metallicities, such as FS90 192, although they are more massive, in the range of 2 − 20 × 109 M⊙.
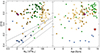 |
Fig. 9. Ages and metallicities of both cEs compared with a sample of cEs and massive compact galaxies from the literature. Left panel: Metallicity as a function of M⋆ in units of 109 M⊙, with FS90 110 and FS90 192 identified by a diamond and a pentagon, respectively. The sample from the literature follows the same symbol coding as in previous figures, where framed symbols depict cEs with mean ages above 10 Gyr. The solid line shows the mass–metallicity relation for massive ETGs (McDermid et al. 2015), with dotted ones representing its dispersion. The dashed line corresponds to the relation fitted by Romero-Gómez et al. (2023) to ETGs from the Fornax cluster. Right panel: Age-metallicity distribution for the same sample of galaxies, with FS90 110 and FS90 192 highlighted, as in previous figures. |
4. Discussion
4.1. Stellar populations
The wide range in ages and metallicities spanned by cEs indicates a variety of evolutionary histories that make it difficult to encompass all of them with a single formation channel. Typically, the locus of cEs in the mass–metallicity diagram is offset from the relation fulfilled by ETGs (Chilingarian et al. 2009; Ferré-Mateu et al. 2018), although differences might exist in the case of isolated cEs (Kim et al. 2020). Although Grèbol-Tomàs et al. (2023) found that old cEs have early and steep star formation histories, presenting high mean metallicities and supra-solar [α/Fe] enhancements, their sample mainly includes cEs more massive than 1010 M⊙, an order of magnitude above the M⋆ of FS90 192. From the extrapolation of the scaling relations derived by the ATLAS3D survey for ETGs (McDermid et al. 2015), the mass-weighted metallicity for a galaxy with a M⋆ comparable to that of FS90 110 spans −0.5 ≲ [Z/H] ≲ −0.3 at 90%, which is less than a third of the metal content calculated for FS90 110 (see Sect. 3.3). In the case of FS90 192, its metal content is also larger than the expected range of ETGs from those scaling relations, −0.6 ≲ [Z/H] ≲ −0.4. The measured [Z/H] for both cEs also exceeds those from dwarfs in the Fornax cluster, according to the linear relation derived by Romero-Gómez et al. (2023), although the difference reduces for FS90 192 if the dispersion of ≈0.15 dex in that scaling relation is also considered. The only two dwarfs from that survey that present a comparable metallicity to that of FS90 110 are also the oldest in the sample, and are presented as probable remnants of more massive progenitors.
Regarding our assumption of supra-solar [α/Fe] enhancement, particularly in the case of FS90 192, it is consistent with the U-shaped relation found by Romero-Gómez et al. (2023), with the [α/Fe] enhancement increasing towards lower masses when M⋆ < 1010 M⊙, as well as for Virgo dwarfs (Bidaran et al. 2023). It is not possible to rule out solar abundances of [α/Fe] for FS90 110, considering the results from stellar population synthesis that suggest an extended star formation history for the so-called inner component (Sect. 3.3). This latter presents a middle-aged population of ≈109 Gyr, which contributes to only 10% of the mass, but represents 40% of the luminosity. The assumption of [α/Fe] = 0 supports the origin of FS90 110 as a remnant from a more massive progenitor, consistent with the photometric evidence of tidal disruption by NGC 3258 presented by Smith Castelli et al. (2008b).
According to Grèbol-Tomàs et al. (2023), two groups of cEs with distinctive star formation histories can be distinguished from those with old populations. The first group includes cEs with intermediate ages, resulting from extended formation histories over time, and the second group contains cEs with two main star-forming episodes: the first burst occurred more than 10 Gyr ago, and the second began around 4 Gyr ago, supposedly caused by the cold gas flow produced by some interaction. From high-resolution simulations, Du et al. (2019) modelled the disruption of a low-mass and gas-rich satellite by its massive host. Although the majority of the gas content is stripped by ram pressure, a fraction survives in the central region and fuels a starburst, supported by the tidal compression produced by the pericentre passages. This inhibits the stellar wind and supernova outflows, leading to an increase in the metal content of this younger population. Eventually, the outskirts of the galaxy are tidally stripped, leaving the enriched centre that becomes a cE galaxy. In the case of FS90 110, although the mass contribution from the most recent star-forming episode is minor, it fits into this latter scenario.
4.2. Kinematical signatures
From the two cEs found in Antlia, signs of tidal interactions have already been noticed in FS90 110 by Smith Castelli et al. (2008b), as a stellar bridge at low surface brightness that connects it with NGC 3258. This suggests a stripping origin, a mechanism already explored through several numerical simulations over the past two decades (e.g. see references in Sect. 1). Studies focused on this formation channel prefer gas-rich galaxies, usually low-mass spirals in radial orbits, as progenitors for cEs (e.g. Martinović & Micic 2017; Du et al. 2019; Deeley et al. 2023; Khoperskov et al. 2023). The presence of rotation outward from the nuclear component could favour the stripping scenario for FS90 110, although results in the literature are not conclusive about the presence of rotation in the remnants. For instance, Deeley et al. (2023) analysed the evolution of cE analogues in IllustrisTNG-50. They differentiate satellite cEs formed via stripping at early stages from galaxies that gradually evolved as compact objects prior to the infall. The latter have experienced few passages through the pericentre of their orbits, and a fraction of them have embedded discs, in comparison with the cEs formed via stripping, which typically fell into the massive halo at z ≳ 1, which have tighter orbits around the central galaxy, with several passages through its pericentre, and which do not present disc structures. On this basis, FS90 110 should belong to the latter group of satellite cEs, and might be undergoing the first stages of its disruption at present. On the other hand, Khoperskov et al. (2023) studied the formation of cEs through the disruption of a dwarf disc progenitor by a Milky Way-like galaxy through a dedicated simulation. They concluded that the initial gas content in the progenitors has a large influence, with gas-rich satellites producing a compact remnant with signs of internal rotation. These findings agree with the properties of FS90 110, as well as several cEs in Virgo (Guérou et al. 2015) and sparser environments (e.g. Ferré-Mateu et al. 2021).
The σLOS as a function of M⋆ for the sample of cEs is shifted towards larger values in comparison with scaling relations for normal ETGs (e.g. Zahid et al. 2016; Damjanov et al. 2022), which has already been addressed in the literature (e.g. Kormendy 1985; Norris et al. 2014). Considering the reff derived from the fitting of Sérsic profiles (see Table 1) and a typical seeing below 1 arcsec for our ground-based spectroscopical observations, it is fair to assume the value of σLOS for the nuclear component of FS90 110 as equivalent to the velocity dispersion up to its effective radius (σeff). The comparison with the scaling relations derived by the ATLAS3D survey for ETGs (McDermid et al. 2015) reveals that [Z/H] of FS90 110 (see Sect. 3.3) is slightly larger than that at reff for ETGs with σeff ≈ 140 km s−1, but in agreement with that derived up to reff/8. This is expected for galaxies that have lost part of their outskirts by tidal disruption, leading to a reduction in their reff and, if the central regions remain relatively undisturbed, the subsequent increase in σeff. Based on numerical simulations from Pfeffer & Baumgardt (2013) for stripping of satellite galaxies, Ferré-Mateu et al. (2018) assume that the internal kinematics of these objects change over larger timescales than those involved in the disruption of the stellar outskirts. This leads to large ratios between Mdyn and M⋆, which gradually decrease close to unity when the remnant restores equilibrium. Comparing the masses derived for the two cEs in Sects. 2.1 and 3.2, they suggest that the tidal disruption of FS90 110 is currently occurring, as is indicated by the low-surface-brightness bridge that connects it with NGC 3258, while FS90 192 might be passively evolving.
Regarding FS90 192, although its σLOS is around a third of that of FS90 110, it is in agreement with the relation fitted to cEs in Sect. 3.2, and it is larger than expected for ETGs with comparable M⋆ (Zahid et al. 2016). Taking into account the ages derived from full spectral fitting (Sect. 3.3), it is worth noting that relic galaxies also present σ above the expected value for the corresponding M⋆ (Grèbol-Tomàs et al. 2023; D’Ago et al. 2023). Although these galaxies are typically more massive than cEs, their interaction with central galaxies that inhabit haloes in the mass range 1013 − 1014 M⊙ can produce remnants that have lost almost all their stellar halo (e.g. Moura et al. 2024).
4.3. Properties from isophotal analysis
Both cEs present negative colour gradients, getting bluer towards larger galactocentric distances. In the case of FS90 192, its (B − I)0 colour evolves gradually up to 5 arcsec, encompassing the radial range of the inner component, in agreement with the lower metallicity that emerges from the full spectral fitting for the spectrum at that radial range. On the other hand, the (B − I)0 colour of FS90 110 remains nearly constant from 1 to 4 arcsec, reflecting the prevalence of old populations with small changes in metallicity. The nucleus is slightly redder, which is expected from the contribution of the intermediate-age population to the flux of the inner component. For the latter, the moderate ellipticity and compactness agree with the findings through high-resolution simulations by Khoperskov et al. (2023) on the remnants of gas-rich dwarfs in radial orbits around a more massive galaxy. The isophotes of FS90 192 remain relatively undisturbed through the entire radial range, its ellipticity does not exceed 0.05, the A4 parameter does not differ from zero, and the only parameter evolving with galactocentric distance is the position angle, reflecting the presence of the third component described in Sect. 3.1. Compared with the low-mass ETGs in clusters compiled by den Brok et al. (2014), the MI magnitude for the nuclear component of FS90 192 agrees with the general trend, but the nucleus of FS90 110 occupies a different locus in the diagram, approximately 2 mag brighter than expected for the bulk of galaxies.
Hence, the signs of rotation and the evidence of an extended star formation history, together with the larger-than-expected velocity dispersion and nuclear brightness, support the scenario of FS90 110 being the remnant of a spiral galaxy that has been tidally disrupted as a consequence of the tidal interaction with NGC 3258. In the case of FS90 192, its population synthesis suggests that star formation is constrained at high redshift. Afterwards, the cE evolved as a low-mass analogue to relic galaxies.
5. Summary
This article presents the analysis of the cEs FS90 110 and FS90 192, both members of the nearby Antlia cluster of galaxies. The dataset includes HST/ACS images and Gemini/GMOS spectroscopic observations in MOS mode, from which we derived structural parameters, besides stellar population synthesis. The M⋆ of the galaxies are 6.1 × 10⁸ and 2.2 × 10⁹ M⊙, respectively, at the lower end of the mass range for cEs. Their properties differ, indicating distinct formation channels. We briefly summarise the more relevant results:
-
The surface brightness profile of both galaxies is properly fitted by three components: nucleus, inner, and outer components. For FS90 110, the brightness of its nucleus is larger than expected for ETGs with comparable M⋆.
-
Both cEs have negative colour gradients, getting bluer towards larger galactocentric radii. The ellipticity of FS90 110 decreases through the galactocentric range ruled by the inner component. Its position angle also changes according to the component that has greater influence at that radial regime. For FS90 192, the ellipticity scarcely exceeds 0.05, and the A4 parameter is consistent with undisturbed isophotes.
-
In the range of 1 − 4 arcsec, FS90 110 presents signs of rotation, suggesting that the so-called inner component is an embedded disc. Although no evidence of rotation is found in FS90 192, observations with different orientations are necessary to draw further conclusions.
-
Both galaxies have σLOS measurements exceeding those for normal ETGs with comparable M⋆, in agreement with previous findings for old cEs.
-
The population synthesis is ruled by old SSPs in both cases, although there is some contribution from intermediate-age populations to the inner component of FS90 110. On the other hand, the spectrum of FS90 192 is fitted by SSPs with ages above 13 Gyr. Both galaxies differ from the mass–metallicity relation described by normal ETGs.
-
The Mdyn derived for FS90 192 agrees with the M⋆ obtained from the integration of the surface brightness profile, but Mdyn doubles M⋆ in the case of FS90 110. A similar result is obtained for both cEs when comparing the (M/LI) ratio derived from their Mdyn with the one calculated from the stellar populations obtained through full spectral fitting.
These results, together with complementary evidence from the literature, lead us to conclude that FS90 110 is the remnant of a disc galaxy, undergoing tidal disruption by its massive neighbour, NGC 3258. On the contrary, FS90 192 seems to have evolved as a low-mass analogue to relic galaxies.
Acknowledgments
This work was funded with grants from Consejo Nacional de Investigaciones Científicas y Técnicas de la República Argentina, Agencia Nacional de Promoción Científica y Tecnológica, and Universidad Nacional de La Plata (Argentina). This research has made use of the NASA/IPAC Extragalactic Database (NED) which is operated by the Jet Propulsion Laboratory, California Institute of Technology, under contract with the National Aeronautics and Space Administration. Based on observations made with the NASA/ESA Hubble Space Telescope, obtained from the data archive at the Space Telescope Science Institute. STScI is operated by the Association of Universities for Research in Astronomy, Inc. under NASA contract NAS 5-26555.
References
- Bassino, L. P., & Caso, J. P. 2017, MNRAS, 466, 4259 [NASA ADS] [Google Scholar]
- Bassino, L. P., Muzzio, J. C., & Rabolli, M. 1994, ApJ, 431, 634 [NASA ADS] [CrossRef] [Google Scholar]
- Bassino, L. P., Richtler, T., & Dirsch, B. 2008, MNRAS, 386, 1145 [CrossRef] [Google Scholar]
- Beasley, M. A., Trujillo, I., Leaman, R., & Montes, M. 2018, Nature, 555, 483 [NASA ADS] [CrossRef] [Google Scholar]
- Bekki, K., Couch, W. J., Drinkwater, M. J., & Gregg, M. D. 2001, ApJ, 557, L39 [NASA ADS] [CrossRef] [Google Scholar]
- Bekki, K., Couch, W. J., Drinkwater, M. J., & Shioya, Y. 2003, MNRAS, 344, 399 [NASA ADS] [CrossRef] [Google Scholar]
- Bidaran, B., La Barbera, F., Pasquali, A., et al. 2023, MNRAS, 525, 4329 [NASA ADS] [CrossRef] [Google Scholar]
- Bressan, A., Marigo, P., Girardi, L., et al. 2012, MNRAS, 427, 127 [NASA ADS] [CrossRef] [Google Scholar]
- Calderón, J. P., Bassino, L. P., Cellone, S. A., et al. 2015, MNRAS, 451, 791 [CrossRef] [Google Scholar]
- Calderón, J. P., Bassino, L. P., Cellone, S. A., & Gómez, M. 2018, MNRAS, 477, 1760 [CrossRef] [Google Scholar]
- Calderón, J. P., Bassino, L. P., Cellone, S. A., Gómez, M., & Caso, J. P. 2020, MNRAS, 497, 1791 [CrossRef] [Google Scholar]
- Cappellari, M. 2017, MNRAS, 466, 798 [Google Scholar]
- Cappellari, M., & Emsellem, E. 2004, PASP, 116, 138 [Google Scholar]
- Cardelli, J. A., Clayton, G. C., & Mathis, J. S. 1989, ApJ, 345, 245 [Google Scholar]
- Caso, J. P., & Richtler, T. 2015, A&A, 584, A125 [NASA ADS] [CrossRef] [EDP Sciences] [Google Scholar]
- Caso, J. P., Bassino, L. P., Richtler, T., Smith Castelli, A. V., & Faifer, F. R. 2013, MNRAS, 430, 1088 [NASA ADS] [CrossRef] [Google Scholar]
- Caso, J. P., Bassino, L. P., Richtler, T., Calderón, J. P., & Smith Castelli, A. V. 2014, MNRAS, 442, 891 [NASA ADS] [CrossRef] [Google Scholar]
- Caso, J. P., Bassino, L. P., & Gómez, M. 2017, MNRAS, 470, 3227 [NASA ADS] [CrossRef] [Google Scholar]
- Caso, J. P., De Bórtoli, B. J., Ennis, A. I., & Bassino, L. P. 2019, MNRAS, 488, 4504 [NASA ADS] [CrossRef] [Google Scholar]
- Chabrier, G. 2003, PASP, 115, 763 [Google Scholar]
- Chilingarian, I., Cayatte, V., Chemin, L., et al. 2007, A&A, 466, L21 [NASA ADS] [CrossRef] [EDP Sciences] [Google Scholar]
- Chilingarian, I., Cayatte, V., Revaz, Y., et al. 2009, Science, 326, 1379 [NASA ADS] [CrossRef] [Google Scholar]
- Cid Fernandes, R., Mateus, A., Sodré, L., Stasińska, G., & Gomes, J. M. 2005, MNRAS, 358, 363 [Google Scholar]
- Ciotti, L. 1991, A&A, 249, 99 [NASA ADS] [Google Scholar]
- Coelho, P., Mendes de Oliveira, C., & Cid Fernandes, R. 2009, MNRAS, 396, 624 [CrossRef] [Google Scholar]
- Cora, S. A., Hough, T., Vega-Martínez, C. A., & Orsi, Á. A. 2019, MNRAS, 483, 1686 [Google Scholar]
- Costantin, L., Pérez-González, P. G., Méndez-Abreu, J., et al. 2021, ApJ, 913, 125 [NASA ADS] [CrossRef] [Google Scholar]
- Daddi, E., Renzini, A., Pirzkal, N., et al. 2005, ApJ, 626, 680 [NASA ADS] [CrossRef] [Google Scholar]
- D’Ago, G., Spiniello, C., Coccato, L., et al. 2023, A&A, 672, A17 [NASA ADS] [CrossRef] [EDP Sciences] [Google Scholar]
- Damjanov, I., Sohn, J., Utsumi, Y., Geller, M. J., & Dell’Antonio, I. 2022, ApJ, 929, 61 [NASA ADS] [CrossRef] [Google Scholar]
- Darvish, B., Mobasher, B., Sobral, D., et al. 2016, ApJ, 825, 113 [NASA ADS] [CrossRef] [Google Scholar]
- Deeley, S., Drinkwater, M. J., Sweet, S. M., et al. 2023, MNRAS, 525, 1192 [NASA ADS] [CrossRef] [Google Scholar]
- den Brok, M., Peletier, R. F., Seth, A., et al. 2014, MNRAS, 445, 2385 [NASA ADS] [CrossRef] [Google Scholar]
- Dirsch, B., Richtler, T., & Bassino, L. P. 2003, A&A, 408, 929 [NASA ADS] [CrossRef] [EDP Sciences] [Google Scholar]
- Drakos, N. E., Taylor, J. E., & Benson, A. J. 2020, MNRAS, 494, 378 [NASA ADS] [CrossRef] [Google Scholar]
- D’Souza, R., & Bell, E. F. 2018, Nat. Astron., 2, 737 [Google Scholar]
- Du, M., Debattista, V. P., Ho, L. C., et al. 2019, ApJ, 875, 58 [NASA ADS] [CrossRef] [Google Scholar]
- Faber, S. M. 1973, ApJ, 179, 423 [NASA ADS] [CrossRef] [Google Scholar]
- Ferguson, H. C., & Sandage, A. 1990, AJ, 100, 1 [NASA ADS] [CrossRef] [Google Scholar]
- Ferrarese, L., Côté, P., Jordán, A., et al. 2006, ApJS, 164, 334 [NASA ADS] [CrossRef] [Google Scholar]
- Ferré-Mateu, A., Trujillo, I., Martín-Navarro, I., et al. 2017, MNRAS, 467, 1929 [NASA ADS] [Google Scholar]
- Ferré-Mateu, A., Forbes, D. A., Romanowsky, A. J., Janz, J., & Dixon, C. 2018, MNRAS, 473, 1819 [CrossRef] [Google Scholar]
- Ferré-Mateu, A., Durré, M., Forbes, D. A., et al. 2021, MNRAS, 503, 5455 [CrossRef] [Google Scholar]
- Forbes, D. A., Spitler, L. R., Strader, J., et al. 2011, MNRAS, 413, 2943 [NASA ADS] [CrossRef] [Google Scholar]
- Frenk, C. S., & White, S. D. M. 2012, Ann. Phys., 524, 507 [NASA ADS] [CrossRef] [Google Scholar]
- Furtak, L. J., Shuntov, M., Atek, H., et al. 2023, MNRAS, 519, 3064 [Google Scholar]
- Gao, H., Ho, L. C., & Li, Z.-Y. 2022, ApJS, 262, 54 [NASA ADS] [CrossRef] [Google Scholar]
- Graham, A. W., Dullo, B. T., & Savorgnan, G. A. D. 2015, ApJ, 804, 32 [NASA ADS] [CrossRef] [Google Scholar]
- Grèbol-Tomàs, P., Ferré-Mateu, A., & Domínguez-Sánchez, H. 2023, MNRAS, 526, 4024 [CrossRef] [Google Scholar]
- Guérou, A., Emsellem, E., McDermid, R. M., et al. 2015, ApJ, 804, 70 [Google Scholar]
- Hess, K. M., Jarrett, T. H., Carignan, C., Passmoor, S. S., & Goedhart, S. 2015, MNRAS, 452, 1617 [Google Scholar]
- Hopp, U., & Materne, J. 1985, A&AS, 61, 93 [NASA ADS] [Google Scholar]
- Huxor, A. P., Phillipps, S., & Price, J. 2013, MNRAS, 430, 1956 [NASA ADS] [CrossRef] [Google Scholar]
- Huxor, A. P., Phillipps, S., Price, J., & Harniman, R. 2011, MNRAS, 414, 3557 [NASA ADS] [CrossRef] [Google Scholar]
- Khoperskov, A. V., Khrapov, S. S., & Sirotin, D. S. 2023, Galaxies, 12, 1 [NASA ADS] [CrossRef] [Google Scholar]
- Kim, S., Jeong, H., Rey, S.-C., et al. 2020, ApJ, 903, 65 [NASA ADS] [CrossRef] [Google Scholar]
- Kormendy, J. 1985, ApJ, 295, 73 [NASA ADS] [CrossRef] [Google Scholar]
- Kormendy, J., & Bender, R. 2012, ApJS, 198, 2 [Google Scholar]
- Li, Z.-Y., Ho, L. C., Barth, A. J., & Peng, C. Y. 2011, ApJS, 197, 22 [Google Scholar]
- Marigo, P., Girardi, L., Bressan, A., et al. 2017, ApJ, 835, 77 [Google Scholar]
- Martinović, N., & Micic, M. 2017, MNRAS, 470, 4015 [CrossRef] [Google Scholar]
- Mayes, R. J., Drinkwater, M. J., Pfeffer, J., et al. 2021, MNRAS, 506, 2459 [NASA ADS] [CrossRef] [Google Scholar]
- McDermid, R. M., Alatalo, K., Blitz, L., et al. 2015, MNRAS, 448, 3484 [Google Scholar]
- Monachesi, A., Trager, S. C., Lauer, T. R., et al. 2012, ApJ, 745, 97 [NASA ADS] [CrossRef] [Google Scholar]
- Moura, M. T., Chies-Santos, A. L., Furlanetto, C., Zhu, L., & Canossa-Gosteinski, M. A. 2024, MNRAS, 528, 353 [NASA ADS] [CrossRef] [Google Scholar]
- Nakazawa, K., Makishima, K., Fukazawa, Y., & Tamura, T. 2000, PASJ, 52, 623 [NASA ADS] [CrossRef] [Google Scholar]
- Norris, M. A., Kannappan, S. J., Forbes, D. A., et al. 2014, MNRAS, 443, 1151 [NASA ADS] [CrossRef] [Google Scholar]
- Paudel, S., Lisker, T., Hansson, K. S. A., & Huxor, A. P. 2014, MNRAS, 443, 446 [NASA ADS] [CrossRef] [Google Scholar]
- Pfeffer, J., & Baumgardt, H. 2013, MNRAS, 433, 1997 [NASA ADS] [CrossRef] [Google Scholar]
- Price, J., Phillipps, S., Huxor, A., et al. 2009, MNRAS, 397, 1816 [NASA ADS] [CrossRef] [Google Scholar]
- Rhee, J., Smith, R., Choi, H., et al. 2017, ApJ, 843, 128 [Google Scholar]
- Ricciardelli, E., Vazdekis, A., Cenarro, A. J., & Falcón-Barroso, J. 2012, MNRAS, 424, 172 [Google Scholar]
- Romero-Gómez, J., Peletier, R. F., Aguerri, J. A. L., et al. 2023, MNRAS, 522, 130 [CrossRef] [Google Scholar]
- Salaris, M., Chieffi, A., & Straniero, O. 1993, ApJ, 414, 580 [NASA ADS] [CrossRef] [Google Scholar]
- Schlafly, E. F., & Finkbeiner, D. P. 2011, ApJ, 737, 103 [Google Scholar]
- Sersic, J. L. 1968, Atlas de Galaxias Australes (Cordoba: Observatorio Astronomico) [Google Scholar]
- Sirianni, M., Jee, M. J., Benítez, N., et al. 2005, PASP, 117, 1049 [Google Scholar]
- Smith Castelli, A. V., Bassino, L. P., Richtler, T., et al. 2008a, MNRAS, 386, 2311 [CrossRef] [Google Scholar]
- Smith Castelli, A. V., Faifer, F. R., Richtler, T., & Bassino, L. P. 2008b, MNRAS, 391, 685 [NASA ADS] [CrossRef] [Google Scholar]
- Smith Castelli, A. V., Cellone, S. A., Faifer, F. R., et al. 2012, MNRAS, 419, 2472 [NASA ADS] [CrossRef] [Google Scholar]
- Spiniello, C., D’Ago, G., Coccato, L., et al. 2024, MNRAS, 527, 8793 [Google Scholar]
- Tempel, E., Saar, E., Liivamägi, L. J., et al. 2011, A&A, 529, A53 [NASA ADS] [CrossRef] [EDP Sciences] [Google Scholar]
- Trujillo, I., Conselice, C. J., Bundy, K., et al. 2007, MNRAS, 382, 109 [NASA ADS] [CrossRef] [Google Scholar]
- Trujillo, I., Ferré-Mateu, A., Balcells, M., Vazdekis, A., & Sánchez-Blázquez, P. 2014, ApJ, 780, L20 [Google Scholar]
- Tully, R. B., Courtois, H. M., Dolphin, A. E., et al. 2013, AJ, 146, 86 [NASA ADS] [CrossRef] [Google Scholar]
- van den Bosch, F. C., Ogiya, G., Hahn, O., & Burkert, A. 2018, MNRAS, 474, 3043 [NASA ADS] [CrossRef] [Google Scholar]
- van Dokkum, P. G., Whitaker, K. E., Brammer, G., et al. 2010, ApJ, 709, 1018 [Google Scholar]
- Vazdekis, A., Sánchez-Blázquez, P., Falcón-Barroso, J., et al. 2010, MNRAS, 404, 1639 [NASA ADS] [Google Scholar]
- Vazdekis, A., Ricciardelli, E., Cenarro, A. J., et al. 2012, MNRAS, 424, 157 [Google Scholar]
- Vazdekis, A., Koleva, M., Ricciardelli, E., Röck, B., & Falcón-Barroso, J. 2016, MNRAS, 463, 3409 [Google Scholar]
- Willmer, C. N. A. 2018, ApJS, 236, 47 [Google Scholar]
- Wolf, J., Martinez, G. D., Bullock, J. S., et al. 2010, MNRAS, 406, 1220 [NASA ADS] [Google Scholar]
- Wong, K.-W., Irwin, J. A., Wik, D. R., et al. 2016, ApJ, 829, 49 [NASA ADS] [CrossRef] [Google Scholar]
- Wu, Y., Liu, C., Peng, E. W., et al. 2022, ApJ, 926, 149 [NASA ADS] [CrossRef] [Google Scholar]
- Yi, S., Demarque, P., Kim, Y.-C., et al. 2001, ApJS, 136, 417 [Google Scholar]
- Zahid, H. J., Geller, M. J., Fabricant, D. G., & Hwang, H. S. 2016, ApJ, 832, 203 [NASA ADS] [CrossRef] [Google Scholar]
All Tables
Parameters of the Sérsic law fits on the surface brightness profiles for both cEs.
Results from the spectral synthesis of the two cEs by means of the code STARLIGHT.
All Figures
|
Fig. 1. Central region of the Antlia cluster of galaxies. Upper panel: DSS image in the R filter of a region containing the gEs NGC 3258 and NGC 3268, with a FoV of 30 × 30 arcmin2. The FoVs of the two ACS fields are marked with red and blue polygons. Both cEs analysed in this article, FS90 110 and FS90 192, are highlighted with circles. Lower panels: F814W images for the two ACS fields, including the Gemini-GMOS slits used for the spectroscopic analysis. The three images follow the usual orientation: north is up and east to the left. |
| In the text | |
|
Fig. 2. Analysis of the surface brightness profiles for FS90 110. Left panels: upper panel presents the surface brightness profiles for FS90 110 in the B (blue circles) and I (red squares) filters. The solid and dashed curves represent the fit of single Sérsic laws. The lower panel illustrates the residuals from these fits for each filter. Right panels: surface brightness profiles for FS90 110 are fitted with three different components, each represented by a Sérsic law. The thin curves depict the individual components, while the thick ones represent their sum. The lower panel displays the residuals from the three-component fit for each filter. |
| In the text | |
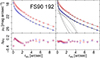 |
Fig. 3. Analysis of the surface brightness profiles for FS90 192, analogous to Fig. 2 for FS90 110. |
| In the text | |
|
Fig. 4. Parameters from the isophotes fit to the surface brightness profiles for both cEs. Left panels: The parameters for FS90 110 are depicted with blue circles and red squares for the B and I filters, respectively. From top to bottom, the panels show the profiles for the colour (B − i)0, the ellipticity (ϵ), the PA, and the parameter A4 from the harmonic expansion, as a function of req. Right panels: Equivalent profiles for FS90 192. |
| In the text | |
|
Fig. 5. Effective radius (reff) plotted against M⋆ on a logarithmic scale for ETGs listed by Calderón et al. (2020) in the photometric catalogue of the Antlia cluster, including candidates (open circles) and spectroscopically confirmed members (filled circles), with the cEs FS90 110 and FS90 192 represented by a diamond and a pentagon, respectively. A sample of cEs from the literature is depicted with green squares (Grèbol-Tomàs et al. 2023), orange triangles (Ferré-Mateu et al. 2018), and upside-down blue triangles (Chilingarian et al. 2009). Open (filled) stars denote massive compact galaxies (relics) from Ferré-Mateu et al. (2017) and Spiniello et al. (2024). |
| In the text | |
|
Fig. 6. Distribution of heliocentric vLOS measured by means of FXCOR, as a function of the galactocentric distance, for both cEs. |
| In the text | |
|
Fig. 7. Velocity dispersion (σLOS) plotted against M⋆ for FS90 110 (large diamond) and FS90 192 (large pentagon), alongside a sample of cEs and massive compact galaxies from the literature. The symbol coding follows that of Fig. 5, and the framed symbols depict cEs with mean ages above 10 Gyr. The solid lines represent the scaling relation for quiescent galaxies from Zahid et al. (2016). The dashed lines show the function fitted to these cEs, while the dotted ones correspond to cEs younger than 10 Gyr. |
| In the text | |
|
Fig. 8. Results from the full spectral fitting to the spectra of the cEs, by means of the code STARLIGHT, scaled to the flux at 4750 Å. Each three-panel plot corresponds to a particular spectrum and set of templates, considering two different [α/Fe] enhancements (see the text for further details). The blue curve represents the observed spectrum and the modelled one is displayed in red, with the residuals in green. The small panels to the right of each spectrum correspond to the age–metallicity distribution of the fitted SSPs, with the size of the circles representing the contribution that each SSP has in the luminosity-weighted (upper panel) and mass-weighted (lower panel) calculus. The crosses correspond to the weighted means for each case. |
| In the text | |
|
Fig. 9. Ages and metallicities of both cEs compared with a sample of cEs and massive compact galaxies from the literature. Left panel: Metallicity as a function of M⋆ in units of 109 M⊙, with FS90 110 and FS90 192 identified by a diamond and a pentagon, respectively. The sample from the literature follows the same symbol coding as in previous figures, where framed symbols depict cEs with mean ages above 10 Gyr. The solid line shows the mass–metallicity relation for massive ETGs (McDermid et al. 2015), with dotted ones representing its dispersion. The dashed line corresponds to the relation fitted by Romero-Gómez et al. (2023) to ETGs from the Fornax cluster. Right panel: Age-metallicity distribution for the same sample of galaxies, with FS90 110 and FS90 192 highlighted, as in previous figures. |
| In the text | |
Current usage metrics show cumulative count of Article Views (full-text article views including HTML views, PDF and ePub downloads, according to the available data) and Abstracts Views on Vision4Press platform.
Data correspond to usage on the plateform after 2015. The current usage metrics is available 48-96 hours after online publication and is updated daily on week days.
Initial download of the metrics may take a while.